Rory Smith (research manager at First Draft), Roger Macdonald (founder of the Internet Archive’s TV News Archive and executive director of the Media-Data Research Consortium) and Kalev Leetaru (founder of the GDELT Project) contributed to this research
Introduction
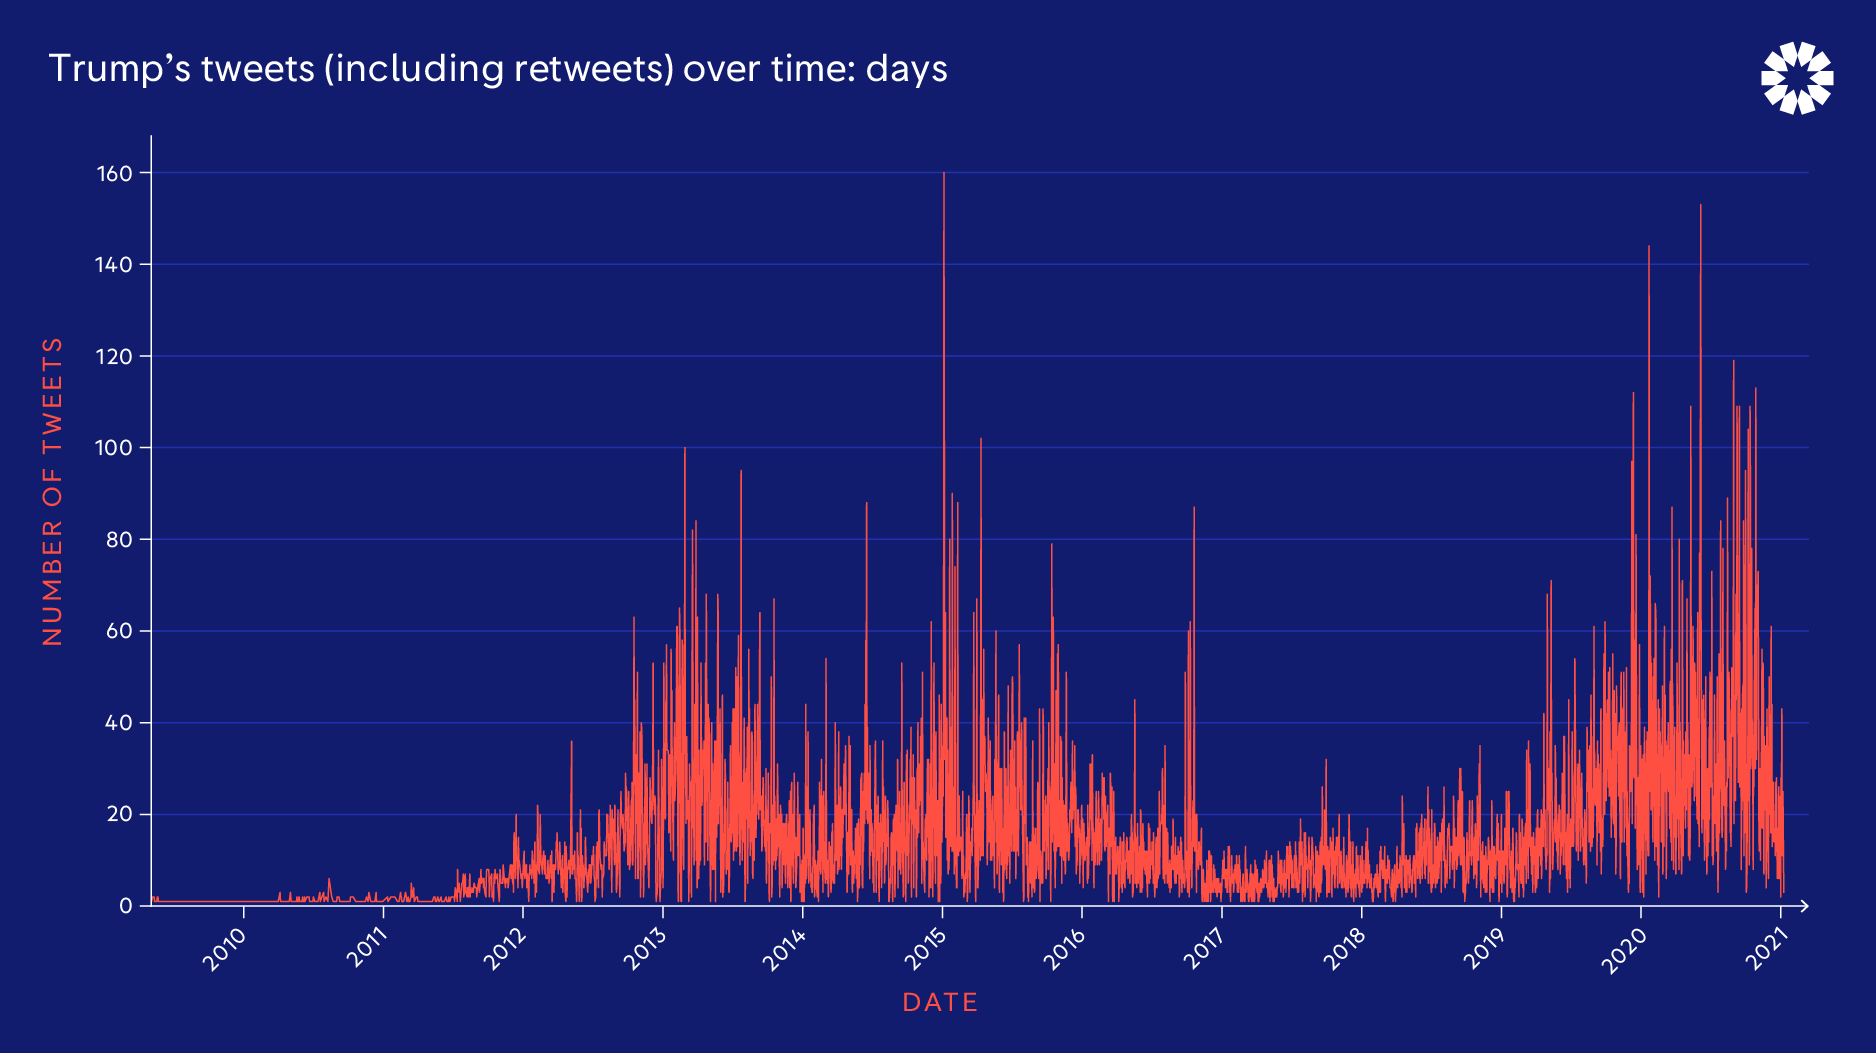
From Donald Trump’s first tweet in May 2009 to his last before Twitter suspended him in January 2021, he was a prolific user of the platform, sharing 56,571 posts (including retweets). Over the years, as Trump shifted from businessman to TV reality star, from candidate to president, a symbiotic relationship between his Twitter feed and television news emerged. Trump’s tweets started to drive the news agenda, and as the ratings appeared to respond positively to the president’s almost-daily stream of consciousness, the mutually reinforcing relationship took hold.
We set out to study this relationship, focusing on the ways cable news covered Trump’s tweets in his final year of office. We gave special attention to tweets during this period that included claims about the integrity of the US presidential election — both his predictions ahead of November 3 and his complaints after Election Day. As we continue to make sense of the events at the Capitol on January 6, we have to understand how that narrative was spread not only by Trump himself, but also amplified by the major 24-hour news networks.

Source: Trump Twitter Archive
According to the Trump Twitter Archive, in the nearly 13 months between January 1, 2020 and January 19, 2021, Trump tweeted 12,392 times. The three major cable networks — MSNBC, Fox News and CNN — broadcast a combined 1,954 of those tweets by showing images of them on screen. These tweets were on screen for a total of 32 hours.
Total airtime MSNBC, CNN and Fox News gave to Trump’s tweets
| Network | Airtime | Percentage of Total Airtime |
| MSNBC | 710 minutes | 37% |
| CNN | 632 minutes | 33% |
| Fox News | 582 minutes | 30% |
| Total | 1924 minutes (32 hrs) | 100% |
Even after Trump’s Twitter account was permanently suspended on January 8, 2021, the three cable networks gave 22.3 minutes of airtime (between January 9 and January 19) to his old tweets. MSNBC and CNN together dedicated nearly half of that airtime (10.6 minutes) to Trump’s tweets alleging election fraud. Never had a president used his worldwide social media reach to declare election fraud — an unprecedented situation for news media.
Though Trump seeded his election fraud narrative far before November 3, nearly three times as many election fraud tweets (158) were broadcast on air in the three months after the election than in the nine months leading up to it (58).
To examine television news coverage of Trump’s tweets, we used the Internet Archive’s Television News Archive and searched each second of airtime on CNN, MSNBC and Fox News for appearances of “@realDonaldTrump” to detect when images of Trump’s tweets were broadcast. We then matched each tweet back to the Trump Twitter Archive. We did not include spoken mentions of his tweets by anchors or correspondents, nor did we include unattributed excerpts from his tweets (such as a quote from one of his tweets that was not credited or was credited to “President Trump” rather than his Twitter handle). Instead, we focused on the times that his tweets were displayed in their entirety onscreen. We wanted to understand the amount of airtime given to this content, not only to understand editorial decisions, but also to understand how Trump’s pronouncements reached people who are not on Twitter. This means that the counts here likely represent an undercount of the total visibility of his posts on television news.
The research identified four characteristics that defined the relationship between these three television networks and Trump’s tweets:
1. The networks reinforced Trump’s assertion that the election would be fraudulent: Between January 1 and November 2, 2020, the three channels displayed 58 different tweets by Trump that mentioned mail-in ballots, his repeated but incorrect assertion that those ballots would cause a fraudulent or “rigged” result, or other general commentary that the election result should not be trusted.
These tweets were on air for a total of 101 minutes.These tweets factored into the agenda for the news media over the last few months of the campaign. With election experts continuing to say there were no serious reasons for concern, Trump’s tweets provided a news “peg” that ensured the conversation continued right up to Election Day.
2. TV coverage focused on claims of fraud with greater intensity after the election: The majority of the airtime devoted to Trump’s tweets questioning the election’s integrity (158 minutes) came after the election. Trump’s tweets continued to command significant airtime even after he had been removed from Twitter.
3. Tweets that had been flagged drew more attention: While the dataset is too small to make causal claims, several tweets that received considerable attention had been flagged by Twitter for being potentially false or misleading. This suggests further research is needed into whether flagging might drive additional attention to tweets that might otherwise have had less visibility.
4. Missing context on false tweets shown on screen: While this research captured only onscreen footage, the absence of consistent flags, labels or chyrons when misleading tweets are onscreen could present a problem when people are watching these channels in public spaces, at home with the sound off, or amid distractions.
Unsurprisingly, this dataset couldn’t answer all our questions, but it underlined the need to understand the dynamics shaping newsroom decisions. As newsrooms carry out postmortems of the events of the past few months, some key questions should include: Would the topics included in the tweets have been covered without the tweets? Did the framing employed by the news outlets mirror the framing from Trump or was it oppositional? What made the tweet newsworthy? How were falsehoods included in a tweet “flagged” to the audience, especially people watching with the sound off? And of course, we need audience research: Did these tweets resonate with viewers who aren’t on Twitter? What level of context do audiences seek when a misleading tweet is broadcast? Did chyrons that included fact checks get noticed?
This type of content analysis allows us to start to understand some of the dynamics between social media content and traditional media. Too often researchers study content from social platforms as if it appears and is consumed in a vacuum. But if we want to start understanding the information ecosystem as a whole, we need to expand our horizons. Indeed, we cannot understand social media without understanding its influence on the news cycle. For example, the Berkman Klein Center for Internet & Society at Harvard University recently noted the role of social media in driving mainstream media emphasis on voter fraud narratives.
Key Findings
Tweets about Electoral Integrity
This research vividly demonstrates how Trump’s Twitter use left newsroom editors with difficult decisions about how to appropriately represent his public statements. Of the 1,954 Trump tweets that appeared onscreen over the 13 months, 210 focused on mail-in ballots, supported the false idea that the election had been stolen or otherwise questioned the integrity of the electoral process by making claims that have been debunked by electoral officials [1]. Between March and November 2, 2020, Twitter flagged 11 of 58 tweets by the former president relating to mail-in ballots or election integrity. They went on to flag 77 of the 210 fraud-related tweets we identified from January 1, 2020 to January 19, 2021 [2], but the absence of labels, demotions or interventions on the 47 other fraud-related tweets that escaped action before the election requires additional research.
In total, across the three channels, 259 minutes of airtime were dedicated to showing tweets by Trump related to mail-in ballots, his repeated but incorrect assertion that they would cause a fraudulent or “rigged” result, or other general commentary that the election result should not be trusted. Without these tweets, the question is whether the television news channels would have dedicated this amount of time to reporting on false claims about mail-in ballots and election security. As Benkler et al’s research, which focused on online media stories, also shows, the mainstream media has played a key role in repeating the narrative of mail-in ballot fraud.
Total airtime given to fraud-related tweets and all of Trump’s tweets between Jan. 1, 2020 to Jan. 19, 2021
| Network | Fraud-related tweets |
All tweets |
| MSNBC | 98 minutes | 710 minutes |
| CNN | 95 minutes | 632 minutes |
| FOX | 66 minutes | 582 minutes |
| Total | 259 minutes (4.31 hrs) | 1924 minutes (32 hrs) |
Changes After the Election
Trump forged his fraudulent election narrative far before the November 3 election, using Twitter to make false claims about how, for example, mail-in ballots have the “tremendous potential for voter fraud.” In the three months after the election, the three cable news networks broadcast nearly three times as many Trump tweets about election fraud than they had in the nine months leading up to it — 152 tweets from November 3 onward, compared with 58 before. Similarly, a majority of the airtime — 61% — devoted to Trump’s election fraud tweets came after the election. Of the ten most aired tweets about fraud in our dataset, six of them came after the election.
In fact, even after Trump was removed from Twitter on January 8, CNN, MSNBC and Fox News continued to show his old tweets. They gave some of these tweets more airtime than they had given his earlier tweets. MSNBC and CNN gave one tweet in particular, posted on December 18, 2020 and claiming the election results were “statistically impossible,” nearly as much on-air coverage in the days following Trump’s Twitter suspension as they had in the three weeks leading up to it.
Impact of Twitter Flags
The Trump tweet that received the most coverage was from May 29, just after George Floyd’s death, and included the phrase “when the looting starts, the shooting starts.” Twitter flagged this tweet with a notice stating that while the post violated the platform’s rules, it would not be removed, as it was in the public interest for it to be accessible.
Of the top ten most-covered Trump tweets, one additional tweet was flagged by Twitter. It was a tweet that opened with the false claim: “There is NO WAY (ZERO!) that Mail-In Ballots will be anything less than substantially fraudulent.” Twitter added a context box underneath with a link to additional information about mail-in ballots. It was the first time Twitter had added a context box to a tweet by the president in this way (it had added a “manipulated media” label to a deceptively edited Biden video in March), which would help to explain the reason for the news coverage.
Labeled Trump tweets received nearly two times (94.45 average seconds) as much on-air coverage as unlabeled tweets (57.02 average seconds). These examples demonstrate that the labels designed to limit the reach of certain tweets can actually be a catalyst for additional television coverage to discuss Twitter’s decision to add a label or provide extra context. This requires additional qualitative research to understand these dynamics.
Missing Context
What needs to be stressed is that even if the spoken-word narration provides necessary contextual information, when the actual tweet is reproduced onscreen and the sound is muted (such as in an office building or airport), the audience sees only the false or misleading message. Sometimes, the lower-third (chyron) did provide context for the tweet, but this was certainly not always the case (as we can see from the illustration below).

Examples on tweets reproduced onscreen.
To explore the consequences of this lack of contextualization, we need further research on audience response. How do these types of segments affect audiences? Do they drive them back to the platform for more context? Did any additional context from the television segment give them a greater understanding of the issue?
Certainly these numbers show that Trump’s tweets were the springboard for at least 32 hours of television content that included his tweets being broadcast directly onscreen. While Trump had almost 87 million followers on Twitter, we don’t know how many actual people saw these tweets — either his followers or other Twitter users who saw retweets.
Audiences for these three channels represent a cross-section of people, many of whom might not follow the Trump Twitter account or use Twitter at all. There is no doubt that this TV coverage put Trump’s tweets in front of people who otherwise would not have seen them.
Conclusions
The next round of research questions requires additional qualitative research. Simply counting how much coverage is not enough. We need to understand how the channels used these tweets to shape coverage, and how they discussed Trump’s claims. Did they verbally fact check the statements? Did they provide additional context to the issue of mail-in voting? Did they suggest additional resources for voters to seek out so they could research the topic themselves?
There are questions here for television newsrooms. What is the criteria for covering social media posts from politicians and other influencers? Are the posts enough to justify a story in their own right? And does that standard change if the content of the post is false or misleading? While it could be argued that the newsworthiness increases, should there be a visual industry standard for demonstrating to audiences (particularly those who can’t hear the presenter or newsreaders) that there is important context to the post?
Representatives from search and social platforms often complain in closed sessions about the role the news media play in amplifying content, irrespective of the decisions the platforms make to flag, demote or remove content. This study is not meant to take any pressure off the platforms and their role in supporting false claims about the integrity of the election, but it’s impossible to focus on one element of the information ecosystem without understanding the wider dynamics.
This research raises more questions that need to be answered, and we would welcome other researchers investigating this dataset. Every segment can be reviewed for analysis and later citation. Content analysis of the broadcast context for every visual presentation of a tweet can be pursued using the TV News Archive [3].
This research is a reminder that tweets from the president can affect coverage decisions within newsrooms. What remains unknown is the impact on audiences.
Methodology
To explore these questions, we used computer vision OCR technology to non-consumptively scan the entire onscreen text of CNN, Fox News and MSNBC frame by frame from January 1, 2020 through January 19, 2021, totaling more than 27,648 hours of programming using the Internet Archive’s TV News Archive. We recorded every appearance of “@realDonaldTrump” and used a combination of human and machine analysis to link each onscreen appearance to the actual tweet being shown. This data analysis was led by Roger Macdonald, founder of the Internet Archive’s TV News Archive and executive director of the Media-Data Research Consortium, a project of Community Initiatives, Kalev Leetaru, founder of the GDELT Project, and Rory Smith, research manager at First Draft.
Endnotes
[1] These tweets were identified using a list of 207 keywords and phrases to filter for fraud-related tweets. The resulting dataset was then manually checked by two coders to identify and remove false positives, i.e., tweets that may have included the word “fraud” but were not related to the recent election. We were conservative in identifying these tweets as we included only tweets that explicitly supported the narrative of election fraud. As such, there are likely instances of tweets by Trump alleging election fraud that were not included in this analysis. You can find the fraud-related tweets we used to conduct this analysis here.
[2] The Trump Twitter Archive has a data field, isFlagged, in its JSON and CSV files that shows whether a tweet was flagged or not.
[3] For example, every segment concerning the president’s August 23 tweet, flagged for violating Twitter Rules about both election integrity and making misleading health claims, can be inspected and cited. Fox News aired two segments: 1st & 2nd. MSNBC aired six segments: 1st, 2nd, 3rd, 4th, 5th & 6th. CNN aired nine segments: 1st, 2nd, 3rd, 4th, 5th, 6th, 7th, 8th & 9th.


