
This recipe is the fourth in our Digital Investigations Recipe Series, a collaboration between the Public Data Lab, Digital Methods Initiative, Open Intelligence Lab and First Draft. It is designed to lift the lid on advanced social media analysis.
Introduction
This recipe gives you the tools to explore conspiracies, misinformation or other networks of polluted content that are linked by YouTube’s recommendation system. You can capture these networks with a predetermined list of videos, such as the list you built in the recipe How to find misleading YouTube videos on fringe platforms, or with videos obtained via YouTube’s search function.
If you are a journalist or researcher, not only can you use this recipe to unearth YouTube content related to your beat and build large datasets around a topic, but it also provides a method of understanding how YouTube’s recommendation system serves as a “radicalization machine” or “rabbit hole” of hyper-personalized and politically aligned content, which is perfect if you are working on investigations or news stories aiming to hold the platform to account.
In the following recipe, we will use the list of YouTube URLs relating to mail-in voting that we curated in the recipe How to find misleading YouTube videos on fringe platforms.
Examples
1. Lewis, R. (2018) Alternative Influence: Broadcasting the Reactionary Right on YouTube. Data & Society Research Institute, p. 61. Available at: https://datasociety.net/wp-content/uploads/2018/09/DSAlternativeInfluence.pdf.
2. YouTube radicalisation project bundle by Dutch journalist Dimitri Tokmetzis (in Dutch). English version here.
3. De Correspondent’s Github page for researching extremism on YouTube.
Ingredients
1. The YouTube Data Tools’ video network module.
2. A spreadsheet editor (e.g., Numbers, Excel, LibreOffice Calc or Google Sheets).
3. Gephi, an open-source network visualization tool, is free. Here is a link on how you can install it. If you are not familiar with Gephi, see the recipe How are they funded? Investigating ad architectures with Gephi and the DMI Tracker Tracker tool. This recipe provides an in-depth explanation of how to use Gephi, which will give you the tools to perform the steps listed in this recipe.
4. Raw Graphs or other data visualization software.
Steps
1. Go to the YouTube Data Tool’s video network module and select the Video network tool. This module will allow you to collect videos that are judged as “related” by YouTube’s in-house recommendation system. For this step, then, you must have a curated list of YouTube videos (with ids) from which to obtain recommendations.
2. You may have collected these ids while monitoring YouTube for health misinformation, or perhaps a political wedge issue for the US 2020 election. You may also build a list of YouTube ids by sourcing them from fringe spaces such as 4chan, 8chan or 8kun. For this recipe, we will be using the “mail-in ballots” 4chan dataset we created in the recipe How to find misleading YouTube videos on fringe platforms.
? It’s always good to check the queries and videos existing misinformation projects have already gathered. OILab has a list of conspiracy queries that you can access here, as well as a list of YouTube “alternative influence network” channels.
3. Use the video ids which are located in the column id.
![]()
4. Before proceeding, make sure to filter for videos that have not been deplatformed (videos indicated as “FALSE” in the column deleted_or_failed). Videos marked as “TRUE” have been deleted. Deleted videos lack important information needed to source a video’s network.
5. Add commas at the end of each video id. In the new column you create (see video below) paste in the function =A2&(“,”) and then hit return. Double click on the little box icon at the bottom right of the cell to fill in the rest of the column. A2 in the function refers to the first row of the id column.
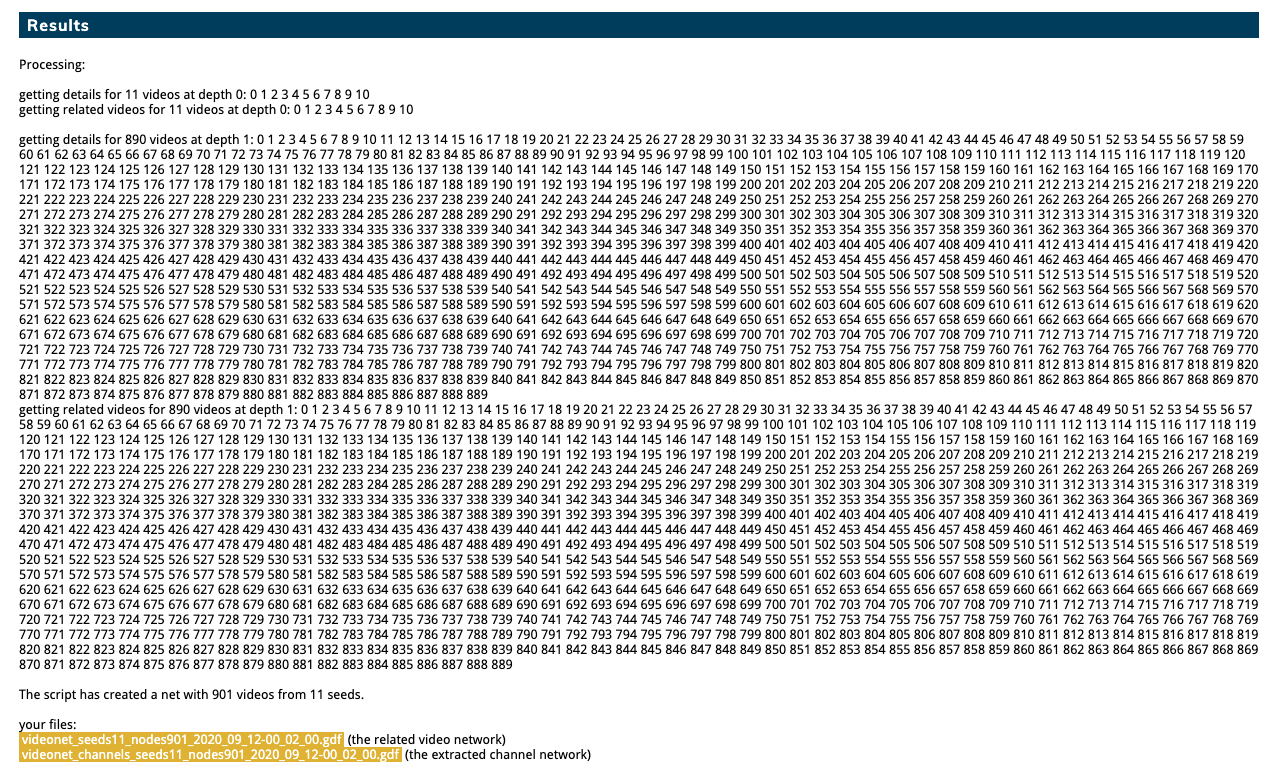
6. Open the Video Network Module and paste the video ids into the Seeds option. Make sure the last item does not include a comma.
7. Choose your crawl depth. If you set the crawl depth to 0, the tool will only process recommendations among videos from your list. Crawl depth 1 will process one iteration of recommendations, while crawl depth 2 will process two iterations of recommendations, i.e., the recommendations of the recommendations. If you have a long list of video ids, crawling at depth 1 or 2 could take a while. Before crawling, make sure that all of the videos are still active. If the video has been taken down since you found it, an error might result when crawling YouTube.
8. You will receive two gdf files as output, the related video network and the extracted channel network. Select the related video network. Gdf files are made to be visualized with Gephi, a network visualization tool.
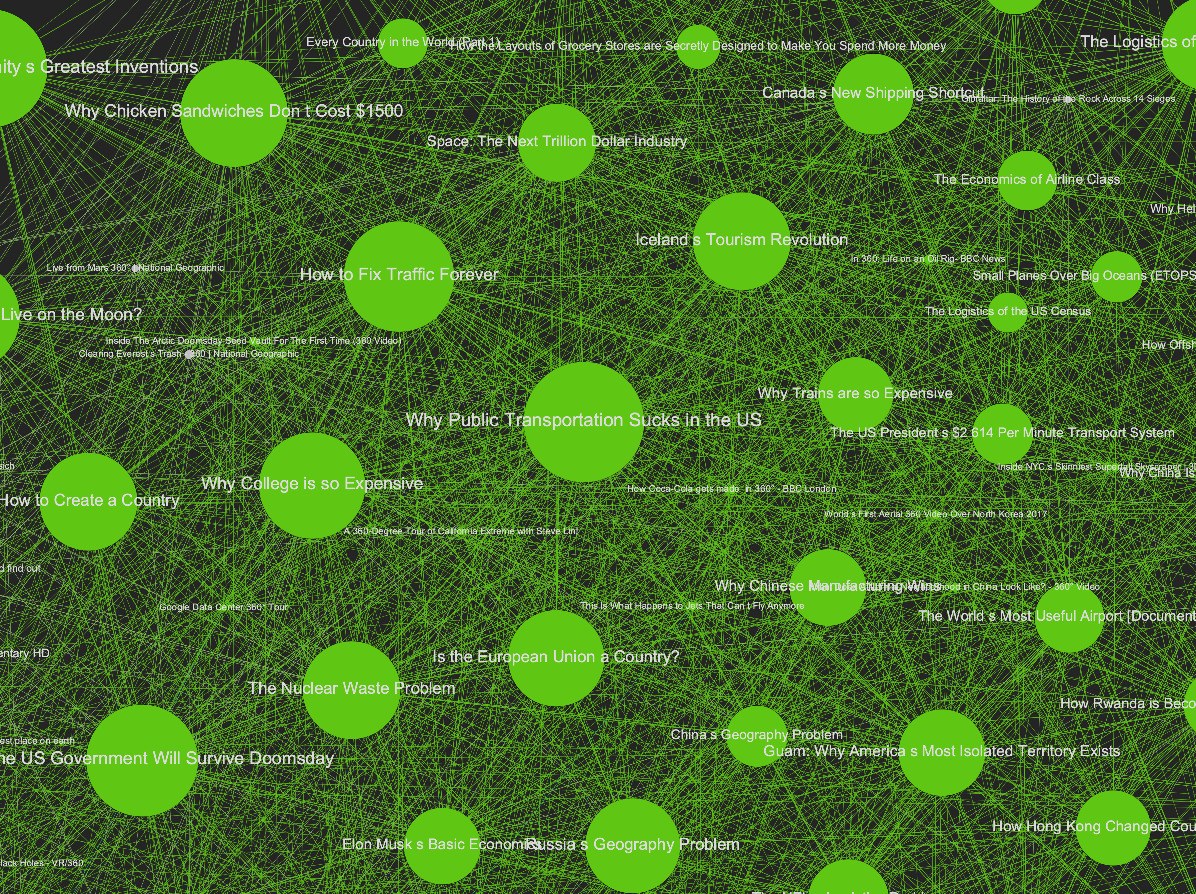
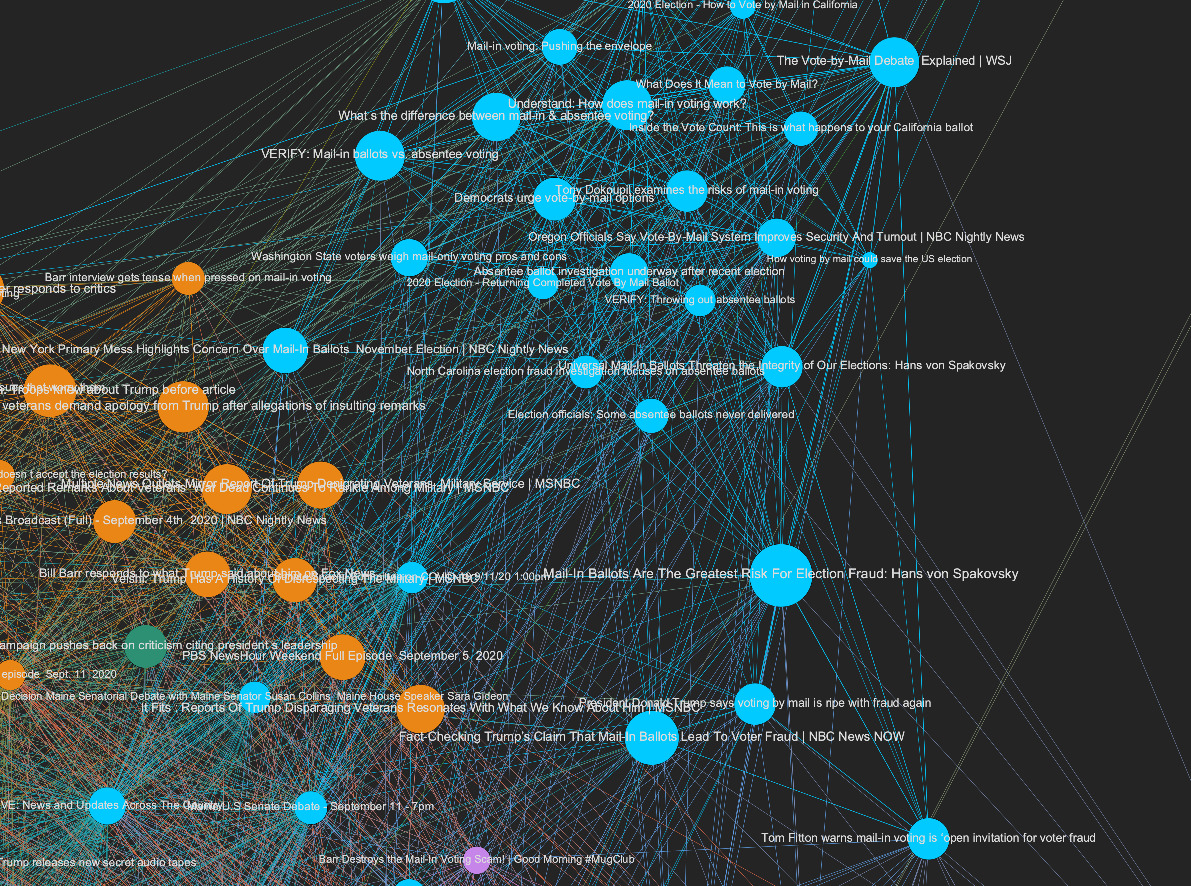
9. Gephi is a potent exploratory tool that shows connections between YouTube videos and clusters of videos in different communities based on their relations with one another. Opening the gdf file in Gephi, we see that there are five main communities, one of which (the cluster in green) is quite separate from the other communities.
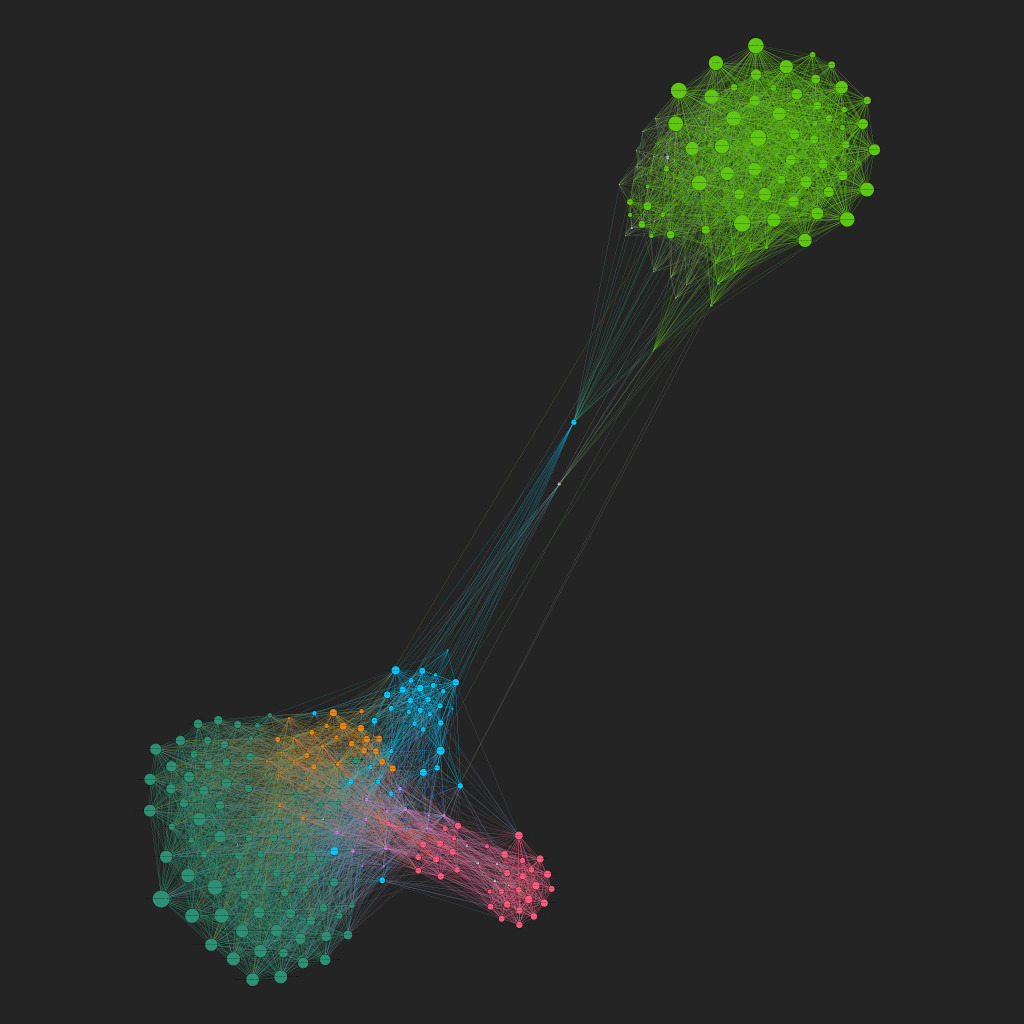
10. On closer inspection, the videos in the green cluster represent educational videos that have little to do with mail-in voting and are only linked to the other cluster through two other educational videos related to voting. We can ignore the green cluster for now as the videos are innocuous and unrelated to claims of mail-in ballot fraud or ballot harvesting.
11. However, in the main cluster, represented by the pink, blue, orange and teal communities, you can find many YouTube videos related to mail-in ballots. On closer inspection, you can also see how the communities are politically distinct and frame the issue of mail-in ballots according to their political position. For example, the pink and blue communities are conservative-leaning and push videos about ballot harvesting, mail-in fraud and other right-wing hot-button issues.
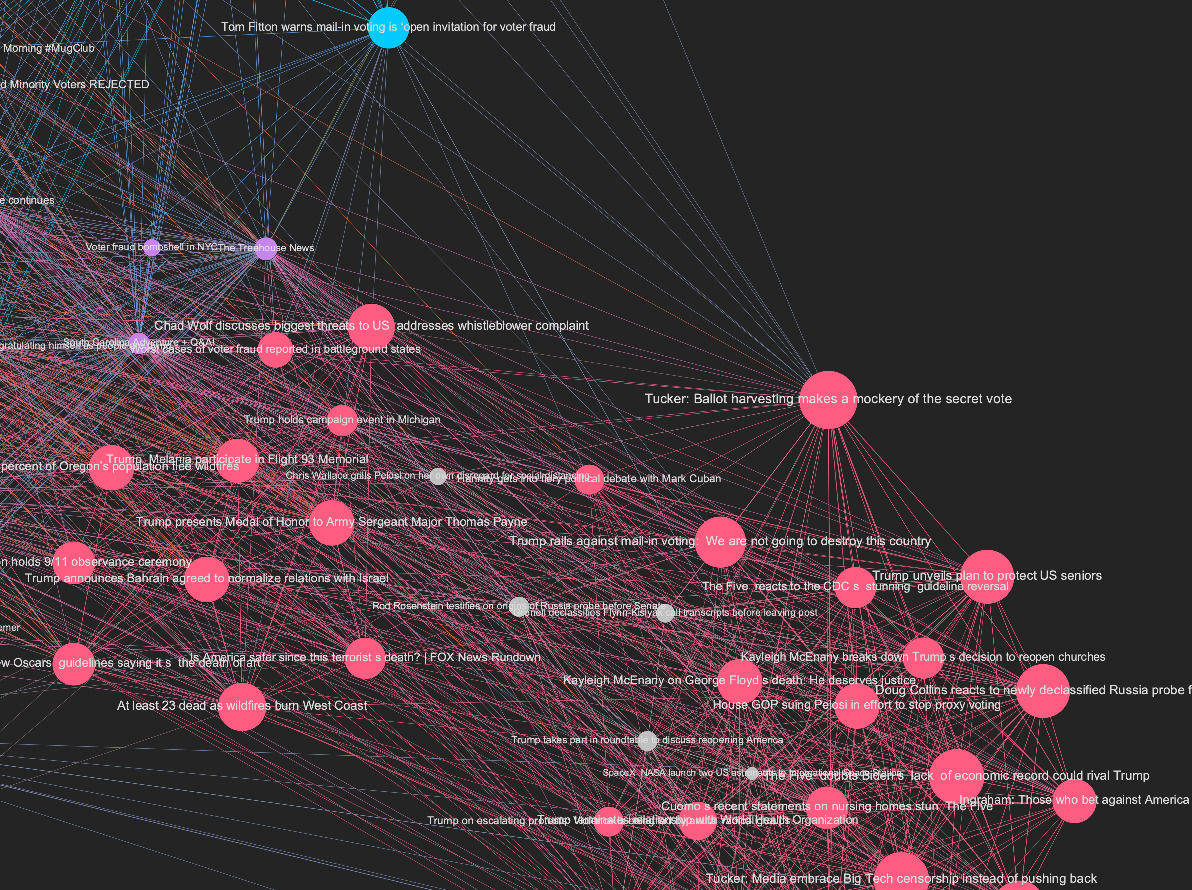
The the teal and orange communities are more moderate and are made up of more objective news videos about voting.
 12. You don’t need to use Gephi to perform meaningful and insightful analysis of this data. You can do much of the same exploratory analysis we did in Gephi using a simple spreadsheet.
13. To get a csv of the same data, open the gdf file in Gephi and navigate to the Data Laboratory.
14. Export the csv file in the Data Laboratory tab and open it on a spreadsheet editor.
15. Once you open the spreadsheet, you can look more closely at the different interactions of the videos to see which were the most popular in terms of views, likes and comments. For example, explore some of the videos with the highest likes (the likecount column) or the highest rate of dislikes to likes (the dislikeratio column) by sorting the data. Click the small arrow at the top of whatever column you are interested in and then select ‘Sort sheet Z → A’.
16. You can manually analyze the content of the videos to find misleading claims by pasting the videos’ id at the end of the link “https://www.youtube.com/watch?v=”. Run it on a web browser.
17. You can also analyze the most common channels in the dataset, to see which videos’ sources appear the most apart from the main news channels. First, select the data by clicking on the little rectangle on the top left side of the sheet. Then go to “Data” on the top menu and select “Pivot Table.”
18. On the new page, you’ll have a few options to determine the rows, columns, values and filters for the pivot table. Select “channeltitle” both under “Rows.”
19. Summarize by “COUNTA” under “Value” and sort in descending order by “COUNTA of channeltitle .”
20. In the example, we see that the most popular channel was Fox News with 138 videos, followed by CNN with 85 videos. It’s important to remember that these are the number of YouTube-recommended videos that resulted from your initial YouTube video list, which you scraped from 4chan. It’s a good idea to make sure your initial list of videos — the ones you scrape from 4chan are specifically related to your topic of interest — as that will provide more meaningful results when you look for their related videos.
21. You may also want to filter out certain video categories before creating a pivot table. For example, you could filter out News & Politics videos in the videocategorylabel. Or you could look at only People & Blogs, which can be fertile ground for finding videos with misinformation.
This recipe details how you can find problematic YouTube videos on 4chan, 8kun or Reddit and then snowball that list with related videos using the YouTube video id. However, you may also use YouTube channel ids as a starting point to see how YouTube’s algorithm recommends other channels based on your initial search. To do this, select the Channel Network Module within YouTube Data Tools, and input the ids of the channels you want to investigate in the seeds box. Then repeat steps 6-20. You may find a standard list of conspiracy theory-related and other YouTube channel ids from this expert list.
Emillie de Keulenaar is a PhD researcher at University of Amsterdam’s Open Intelligence Lab and Simon Fraser University’s Digital Democracies group. She has previously researched with the UN’s Innovation Cell, the Dutch digital humanities cluster CLARIAH, the European Time Machine consortium and the Clingendael Institute. Her interests lie in the role of deep disagreements in producing misinformation, as well as in the history of moderating online hate speech and other problematic information.