
By Jonathan Gray, Mathieu Jacomy, Liliana Bounegru and Rory Smith
This recipe is the first in our Digital Investigations Recipe Series, a collaboration between the Public Data Lab, Digital Methods Initiative, Open Intelligence Lab and First Draft. It is designed to lift the lid on advanced social media analysis.
Introduction
With Covid-19 vaccine rollouts taking place globally, there is increased concern about anti-vaccine activism and vaccine misinformation proliferating online and contributing to higher rates of vaccine skepticism. Tech companies have said they’ve taken steps to reduce the spread of anti-vax content (e.g., YouTube removing ads or GoFundMe stopping anti-vax fundraisers). But what about anti-vax websites? What kinds of ad architectures do these sites use? How do they aim to make money to support their work and spread their messages?
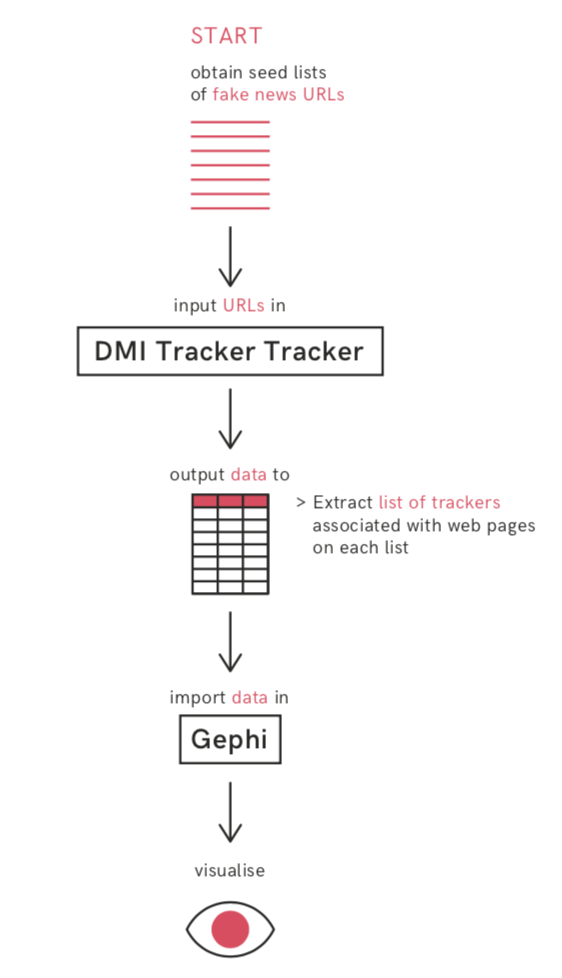
This recipe explores how to use Gephi and the DMI Tracker Tracker tool to investigate web tracking devices associated with a given set of websites. These include but are not limited to advertising-related trackers. Using this recipe to investigate anti-vax sites, you will be able to see the prominence of tracking products from big tech companies, which these websites try to use (not always successfully) to monetize their content, and how anti-vax websites are set up, including their use of programmatic advertising.
For journalists and researchers, this recipe will uncover how anti-vax websites seek to reach their audiences, how they intend to make money and, importantly, the role of big tech companies in facilitating the reach of this content.
Ingredients
1. List of websites to investigate
2. DMI Tracker Tracker tool: https://tools.digitalmethods.net/beta/trackerTracker/. The DMI Tracker Tracker tool builds on Ghostery to surface all the web tracking technologies on websites and converts this data into a csv for further data analysis or into a GEFX file for use in Gephi. You can read more about how Ghostery detects third-party web trackers here. For other third-party tracker or HTTP requests detection services and approaches, see, e.g., Mozilla’s Lightbeam.
3. RawGraphs: a visualization tool.
4. Gephi: http://gephi.org/. Gephi is an open-source network visualization tool used to explore the different links and communities in your data.
Steps
This is a recipe for exploring the web trackers associated with a given set of websites. Trackers are small bits of code embedded in websites that are used to do things such as monitor engagement, quantify website visits, track user behavior and assess the effectiveness of ads.
We will look at how data about web trackers can be repurposed in order to investigate the technical and commercial underpinnings of websites, using the example of a list of anti-vax websites that was examined with First Draft.
In particular we will look at how to make a list of websites, how to obtain lists of tracking devices associated with them, and how to compare tracking configurations using “visual network analysis” with the open-source Gephi software demonstrated by its co-creator, Mathieu Jacomy.
The recipe draws on A Field Guide to “Fake News” and Other Information Disorders, as well as work by researchers at King’s College London’s Department of Digital Humanities, the Digital Methods Initiative (University of Amsterdam) and beyond. For details of other related projects, see the “further reading and resources” section.
Step 1: Assemble a list of anti-vax websites
First we need a list of websites to investigate. This could be a list that you compile yourself, an existing list from others (e.g., a list of websites deemed problematic) or a list generated through the triangulation and curation of other lists. Whichever you choose, you should have a rationale behind your selection, because what is on the list and how the list was created will shape the kinds of questions you are able to address and the kinds of findings you are able to make.
Lists are important ways of grouping things. Lists are not just neutral reflections of natural groupings, but require all kinds of ways of thinking, conceptualizing, classifying and organizing — different kinds of memberships and different kinds of criteria for determining who and what is included and excluded. As such, they depend on all kinds of social practices of “sorting things out.”
Lists are devices of practical work in many social, cultural and political settings (whom to invite, whom to include, whom to represent, what needs doing). They can be both used and studied in the course of research. Umberto Eco has written about how lists are also sources and objects of humor, parody, faith and poetry. List-making is so diverse and ubiquitous that Wikipedia even has a list of lists of lists.
Lists have their own politics (e.g., who makes them, who is included, who is left out, what the criteria are), and this may be an interesting area to explore rather than taking for granted. If you are using or incorporating different lists from different sources, you may wish to compare them. To what extent is there consensus about the list members? Is there convergence or divergence? One simple way to compare them (although not critical to this recipe) is to use the Digital Methods Initiative Triangulation tool, where you can copy and paste your lists and see the differences between them.
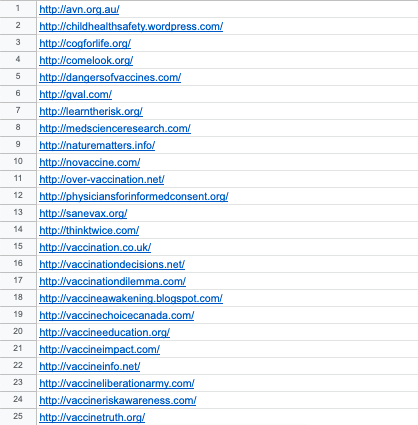
The list of 60 websites that we are using to illustrate this recipe was compiled by cross-referencing research literature and other resources that examine anti-vax websites combined with further input and suggestions from First Draft on some more recent notable cases. The list was derived from reviewing over 60 research papers (2000-2020) and over 80 websites about the anti-vax movement, which resulted in over 150 URLs that were subsequently filtered to focus on websites with an explicit or exclusive focus on vaccination and associated issues.
For present purposes the list is intended to be illustrative rather than comprehensive, so we can look into the configurations of some prominent anti-vax websites rather than making claims about all anti-vax websites. It is also exploratory, in order to identify lines of inquiry for future investigations.
You should create a “clean” list of URLs for the entities you wish to study — with only the URLs and no associated text, formatting or spacing. You may wish to do this in a plain text editor (e.g., the open-source Atom.io editor) or in a spreadsheet (such as Excel, LibreOffice or Google Sheets). Make sure to include the http:// at the start.
Step 2: Input this list into the DMI Tracker Tracker to obtain the associated trackers.
It is important to note that all past results of the Tracker Tracker tool are publicly archived under the “past jobs” tab on the top left corner of the page. So do not include personal information or details that you would not want to be publicly available in either the text box or the name of your output.
For this step we will gather data on third-party tracking devices associated with our list of websites. We will be using the Digital Methods Initiative Tracker Tracker tool, which builds on the Ghostery database, which at the time of writing contains “4,500 trackers from over 2,600 companies.”
As Ghostery puts it, trackers are “small pieces of code on a website” which “load when a user visits a website” and “collect and relay information about the user’s current browsing situation (device type, location, IP address, etc.) to the tracker operator.” The Tracker Tracker tool “analyses the source code of each page included to detect predefined fingerprints of known web tracking technologies” using the Ghostery database.
To use the tool, you can simply copy and paste the list you generated in the previous step into the box (one URL per line), provide a meaningful and memorable name for the output and click “track trackers” (as in the screen capture above). You can track progress in the “process log” box.
Once the tool has finished retrieving details of the trackers associated with your URLs, you will see the final messages in the process log (“Collating results / Removing identical matches / rebuilding results / Cleaning up”). Then you can navigate to the “output” menu at the top of the page in order to view and download your results (see screen capture). At this point you should make sure and download all of the files so that you have them for future reference.
What do these outputs contain? What do they mean? What can be inferred from them? If you open the first CSV file and import this into a spreadsheet file, you can see the full outputs (if you are using Excel you may need to “import” and select the way the columns are delimited so that it opens correctly). This includes the “url” column on the left, with one row per tracker associated with each, the type of tracker (e.g., analytics, ad, widget — you can find a recent description of these from Ghostery here) and the full names of each tracking device.
This can tell us about what Liliana Bounegru calls “audience marketplace configuration” — how the websites have sought to use tracking devices in order to monitor, engage with and monetize the activity of their users. It is important to note that this does not necessarily tell us directly about the flows of data or money resulting from these tracking devices. For example, it is possible that something is not working, or that websites have been blacklisted by advertising providers. In order to see whether ads are being served you’d need to take some additional steps, such as visiting and screenshotting the websites. For examples of approaches for estimating revenue, you can see recent work from CEU (here) and the Disinformation Index (here, here and here).
What you can tell is which kinds of tracking devices have been embedded in your list of websites, and therefore how website publishers have sought to use different tracking products. This may include how they have sought to make money from their content through advertising, how they have sought to integrate different social media platforms to build up their audiences, and the kinds of services and components used by their sites.
Step 3: Visualizing the makeup of types of trackers and their names
As well as looking at the trackers on a site-by-site basis, one can also look for patterns in the configuration of tracking devices across your initial list. To do this, first delete all the null values in your spreadsheet. These are labeled as n/a. Then delete all the columns between type and name — type refers to the type of tracker and name is the name of the service providing that tracker. Copy both columns and paste then into RAWGraphs. Then select Alluvial Diagram and drag both type and name over to the steps box. An alluvial diagram should appear showing the kinds of trackers as well as the names of the most popular services. In this instance, we see that DoubleClick (a product of Google), Google Analytics and Facebook Connect are the most popular tracker services used by the anti-vax websites in our list.
Step 4: Import resulting GEFX file into Gephi software for visual network exploration
Now that we have a dataset of websites and their third-party tracking devices, we can use the open-source Gephi software in order to explore the relations between them.
You can download Gephi at: https://gephi.org/
If you’ve not used Gephi before, you can find further details from its co-creator, Mathieu Jacomy, on installing it, setting it up and getting started in the following videos:
- https://www.youtube.com/watch?v=DMOWhqp6lHQ
- https://www.youtube.com/watch?v=YM_37z_uURM
- https://www.youtube.com/watch?v=0LqY8OfSsKE
In the output from the Tracker Tracker tool you will have downloaded a GEFX network file, which you can now open and explore in Gephi. Below you can find a short video walkthrough of steps you can take in Gephi in order to spatialize and explore the relations between websites and their trackers.
A brief note on the vernaculars of Gephi and visual network exploration. We call the points in the network “nodes” and the relations between them “edges.” In this case we have two types of nodes — websites and trackers — so it is a “bipartite network.” As explained further in the video we can use spatialization algorithms such as Force Atlas 2 to spatialize the nodes so that the distance between websites and trackers corresponds to the number of connections between them: those with more connections will be closer and those with fewer connections will be further away.
Networks can be used as exploratory devices or explanatory devices in journalism: to surface stories, identify lines of inquiry, present findings to readers, or a combination of these. You can read more about the different ways that networks are used in the context of journalism in this article.
Step 5: Accompanying analysis, including further desk research on tracking products
So what can you do with this network? What can it tell you about the tracking practices of anti-vax websites?
From the visual network exploration above, we can observe the prominence of “big tech” companies (e.g., Google, Facebook, Twitter) and their products in the “audience marketplace configurations” of anti-vax websites. We can identify different “audience marketplace configurations,” providing a more behind-the-scenes look at how these websites are configured, how they work and how they seek to make money. For example, we can see some websites that appear to use WordPress, Gravatar and Disqus (with the latter implying the presence of user accounts and social features). With one website we can see the use of OpenX, AppNexus and other products associated with “programmatic advertising.”
These observations may be used to inform further investigations and follow-up research. This may include interface analysis and screenshots to compare the tracking configurations with appearance and user experience of visiting a website (including possible personalization features, ads, banners and so forth).
Visual network analysis can serve as a way to identify interesting stories and leads for digital investigations into lists of websites and the tracking devices associated with them, which may take you out of the network and off to other spaces, materials and actors to follow.
Further readings
Bounegru, L., Gray, J., Venturini, T., & Mauri, M. (Eds.). (2018). Using Tracker Signatures to Map the Techno-Commercial Underpinnings of Fake News Sites. In A Field Guide to “Fake News” and Other Information Disorders. Amsterdam: Public Data Lab. Available at: http://fakenews.publicdatalab.org/
Deville, J., & van der Velden, L. (2016). Seeing the Invisible Algorithm: The Practical Politics of Tracking the Credit Trackers. In L. Amoore & V. Piotukh (Eds.), Algorithmic Life: Calculative Devices in the Age of Big Data (pp. 87-106). New York: Routledge.
Digital Methods Initiative. (2012). Field Guide to Trackers and the Cloud. Amsterdam: Digital Methods Initiative. Available at: https://wiki.digitalmethods.net/pub/Dmi/TrackersGuide/TrackerGuide_reduced.pdf
Digital Methods Initiative (2015). Tool: Tracker Tracker. YouTube. Available at: https://www.youtube.com/watch?v=UZpOrtjkyno
Gerlitz, C., & Helmond, A. (2013). The Like Economy: Social Buttons and the Data-Intensive Web. New Media & Society, 15(8), 1348-1365. https://doi.org/10.1177/1461444812472322
Gray, J., Bounegru, L., & Venturini, T. (2020). ‘Fake news’ as infrastructural uncanny: New Media & Society. https://doi.org/10.1177/1461444819856912
Helmond, A. (2012, March 12). Visualizing Facebook’s Alternative Fabric of the Web. Available at: http://www.annehelmond.nl/2012/03/12/visualizing-facebooks-alternative-fabric-of-the-web/
Helmond, A. (2017). Historical Website Ecology: Analyzing Past States of the Web Using Archived Source Code. In N. Brügger (Ed.), Web 25: Histories from the First 25 Years of the World Wide Web. New York: Peter Lang.
Rogers, R. (2019) Tracker analysis: Detection techniques for data journalism research. In Doing Digital Methods. London: Sage Publishing.
Share Lab. (2015, March 6). Invisible Infrastructures: Online Trackers. Available at: https://labs.rs/en/invisible-infrastructures-online-trackers/
Van der Velden, L. (2014). The Third Party Diary: Tracking the Trackers on Dutch Governmental Websites. NECSUS. Available at: https://necsus-ejms.org/third-party-diary-tracking-trackers-dutch-governmental-websites-2/
The recipe was developed as part of a collaboration between the Public Data Lab and First Draft. It builds on the Field Guide to “Fake News” and Other Information Disorders and is supported by King’s College London’s Department of Digital Humanities and the AHRC-funded “Infodemic” project. The underlying research on audience marketplace configurations is based on Liliana Bounegru’s work on News Devices. The research on tracking networks is based on the work of the Digital Methods Initiative (see e.g., Helmond, 2017). You can also read more in Gray, Bounegru and Venturini, 2020.
Jonathan Gray is Lecturer in Critical Infrastructure Studies at the Department of Digital Humanities, King’s College London, where he is currently writing a book on data worlds. He is also Cofounder of the Public Data Lab; and Research Associate at the Digital Methods Initiative (University of Amsterdam) and the médialab (Sciences Po, Paris). More about his work can be found at jonathangray.org and he tweets at @jwyg.
Mathieu Jacomy is a PhD student in techno-anthropology at the Aalborg University TANT Lab. He was a research engineer for 10 years at the Sciences Po médialab in Paris, and is a co-founder of Gephi. He develops digital instruments involving data visualization and network analysis for the social science and humanities. His current research focuses on visual network analysis, digital methods and issue mapping. He contributes to developing the web crawler Hyphe, the online network sharing platform MiniVan, and Gephi. He tweets at @jacomyma and blogs at reticular.hypotheses.org.
Liliana Bounegru is Lecturer in Digital Methods at the Department of Digital Humanities, King’s College London. She is also co-founder of the Public Data Lab and affiliated with the Digital Methods Initiative in Amsterdam and the médialab, Sciences Po in Paris. More about her work can be found here. You can follow her on Twitter at @bb_liliana.