
This recipe is the fifth in our Digital Investigations Recipe Series, a collaboration between the Public Data Lab, Digital Methods Initiative, Open Intelligence Lab and First Draft. It is designed to lift the lid on advanced social media analysis.
Introduction
Misinformation and conspiracy theories are not static. They move from one platform to another, often promulgated by organized online communities that seed this information across the web. Oftentimes, this polluted content originates from some of the lesser-known spaces on the web, such as 4chan and 8kun, with no content moderation policies, before spreading to more mainstream platforms such as Facebook, Twitter and TikTok. For journalists tracking the spread of misinformation or a conspiracy theory, it’s not only important to understand the origins and motivations of a falsehood, such as where it came from and who is behind it, but also to understand its growth or loss of popularity.
The following recipe will give journalists and researchers the tools to investigate the spread of harmful narratives as well as the content being disseminated by particular communities on 4chan, 8kun and Reddit. It will also allow journalists to compare the spread of this content across platforms over time to better understand when and where these narratives or pieces of misinformation began to circulate.
Examples
1. Hagen, S. et al. (2019) ‘Understanding Normiefication: A Cross-Platform Analysis of the QAnon Conspiracy Theory’, Digital Methods Initiative, 21 February. Available at: https://wiki.digitalmethods.net/Dmi/WinterSchool2019Normiefication.
2. de Keulenaar, E., Kisjes, I. and Tuters, M. (2020) ‘How Kekistan united and divided the Right: Transcoding an incoherent movement’. Memes: The Cultural Logic of Late Capitalism?, King’s College London, May. Available at: https://www.youtube.com/watch?v=R8zNInqal7o (36:20-51:32) (Accessed: 18 June 2020).
Ingredients
1. 4CAT. 4CAT is a dashboard-like tool that scrapes data from Reddit, 4chan, 8chan, 8kun, Breitbart, Instagram, Telegram and Tumblr. It hosts a suite of natural language processing and other statistical tools designed to facilitate the study of social media content and misinformation. The tool is free and there are detailed instructions on how you can install 4CAT on your own computer or server.
2. A spreadsheet editor (e.g., Numbers, Excel, LibreOffice Calc or Google Sheets).
3. Raw Graphs.
Steps
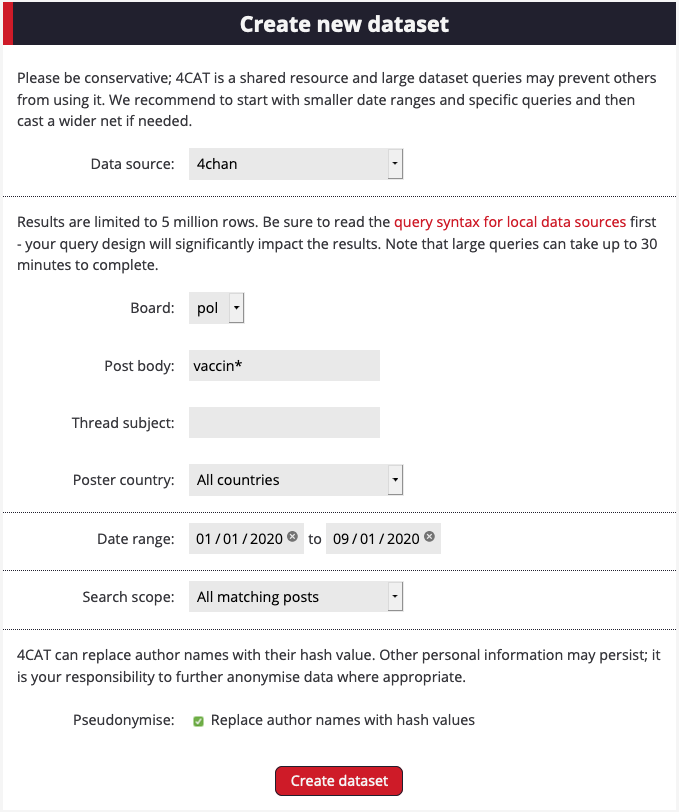
1. To build a cross-platform dataset, open 4CAT and select the platform from which you would like to obtain data. This recipe will begin with 8kun and work its way to 4chan and Reddit.
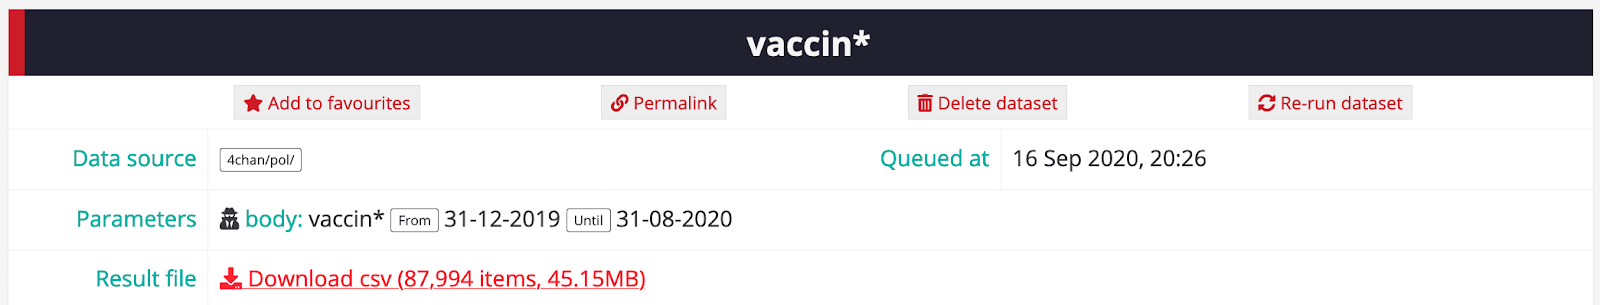
2.Choose a search query that reflects the narrative, key piece of misinformation or conspiracy in which you are interested. For this example, we will be investigating vaccine narratives and misinformation, and as such, we will use the term vaccin* in the Post body search box. The * symbol is a wild card. It will look for vaccin and any other words that begin with that root word, such as vaccine, vaccines, vaccination and vaccinations. You can find more information here on advanced search operators within 4CAT.
? Remember: 4CAT works with Boolean queries, but has a different syntax than most tools. Instead of “OR” or “AND”, please use these characters.
3. Enter your query and select a date range, if applicable. Limiting your results to a relevant date range, i.e., where an event occurred that may have influenced or started a narrative, will help prevent false positives and noise in your results.
4. Once your dataset is ready, repeat the process in other platforms. 8kun can be queried in the same way as 4chan. For Reddit, make sure you target relevant subreddits. This recipe looks for narratives, misinformation and conspiracy theories around coronavirus and vaccines, so it uses r/conspiracies, r/coronavirus, r/covid19 and r/ChinaFlu, which often post about these issues.
? When in doubt, Google it! The subreddit r/ChinaFlu was found by Googling “vaccine covid reddit.” You can try using Google advanced searches, such as “site:reddit.com (covid OR corona OR rona) AND (vaccine) to further hone your query. You can also consult this list of subreddits with their descriptions, or feel free to explore what Reddit has to offer.
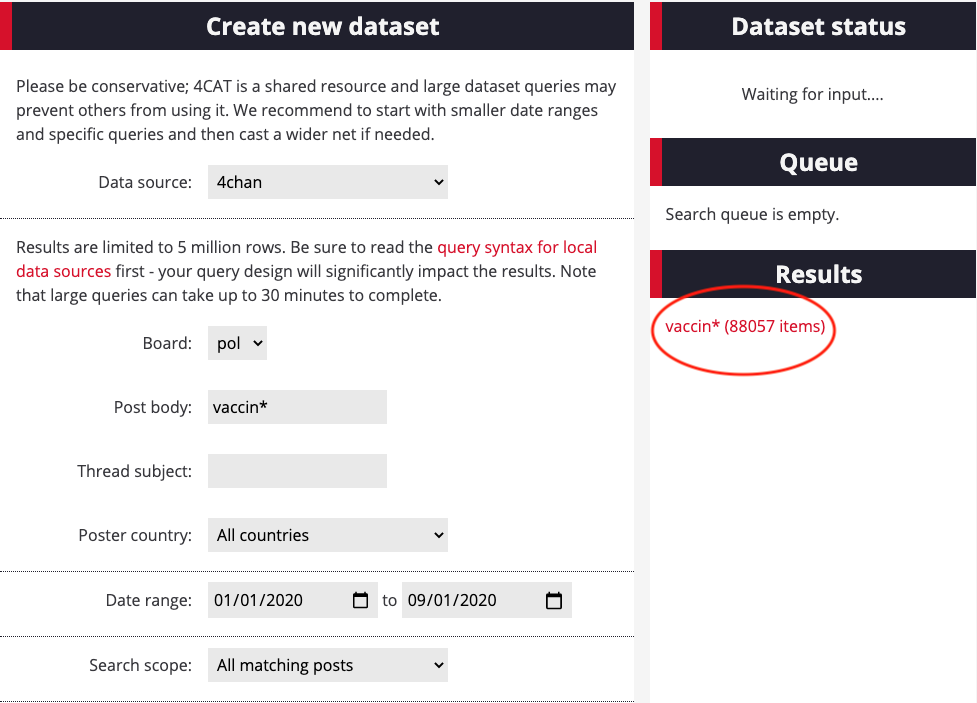
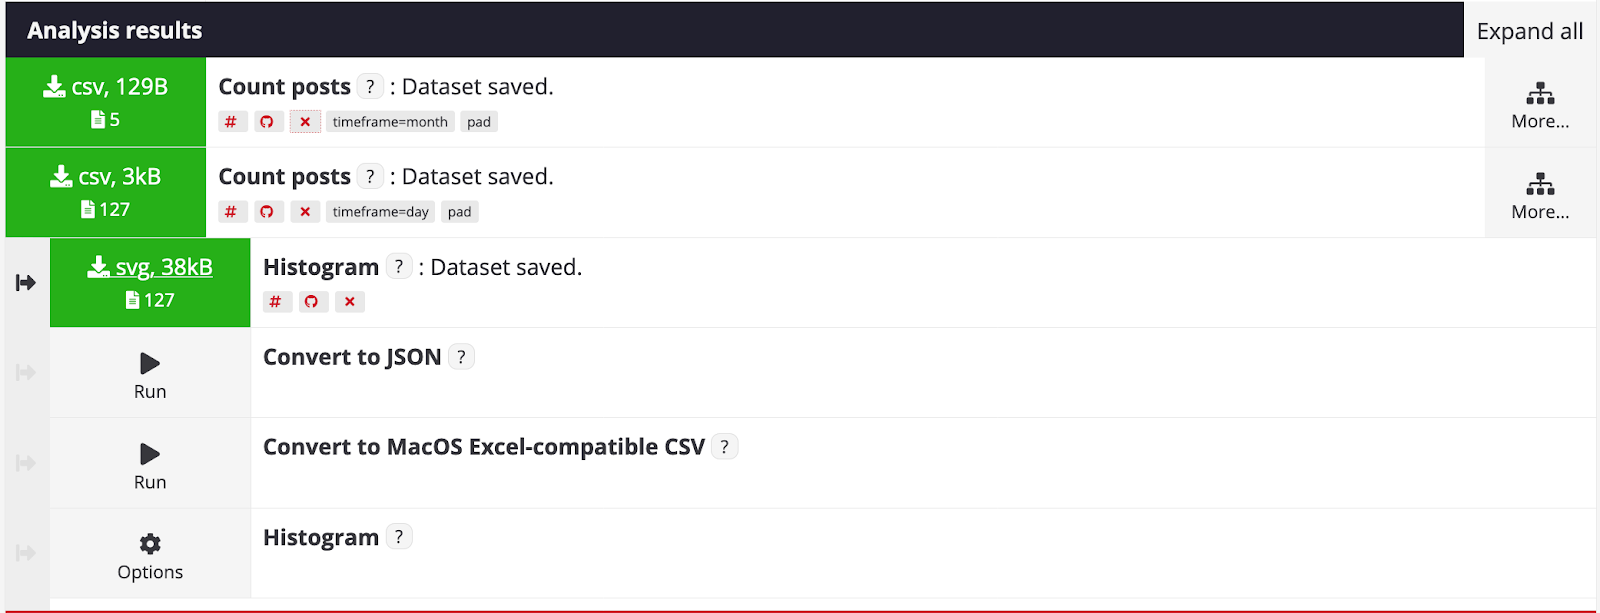
5. Once your results are ready, get a sense of how conversations around vaccines played out over time. When did vaccine-related posts spike or dip? Are there any logical explanations for this? You can navigate to the Analysis section of 4CAT by clicking on the output under results that will emerge when your data is ready.
6. Select “Count posts,” which you can find under “Post metrics.” This tool will allow you to count the number of posts that contain your queries in a given timeframe: overall, per year, month, week or day. Make sure you use the same timeframe for all other datasets, otherwise your data and analysis will be inconsistent. We have opted to count posts per day in this dataset.
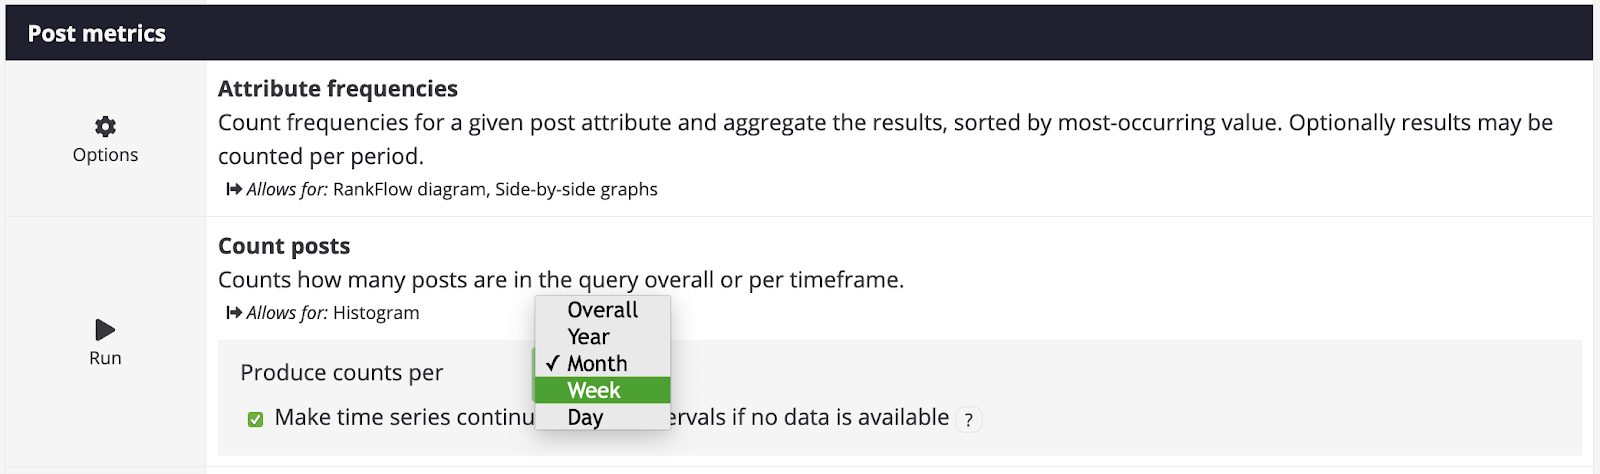
? For 4chan and 8kun we use the number of posts over time (in this case by day) as our engagement metric. Reddit has several unique metrics, such as “upvotes” and “downvotes.” These may be helpful if you are just looking at Reddit, but if you want to draw meaningful comparisons between the platforms, i.e., to see when content related to your search query rose or fell over time, we recommend that you also use the number of posts per day for Reddit.
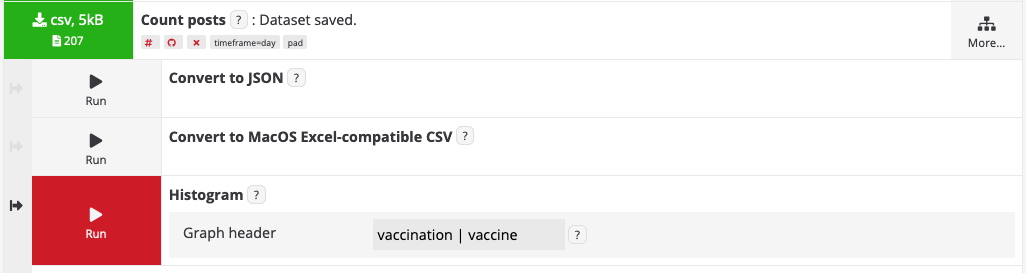
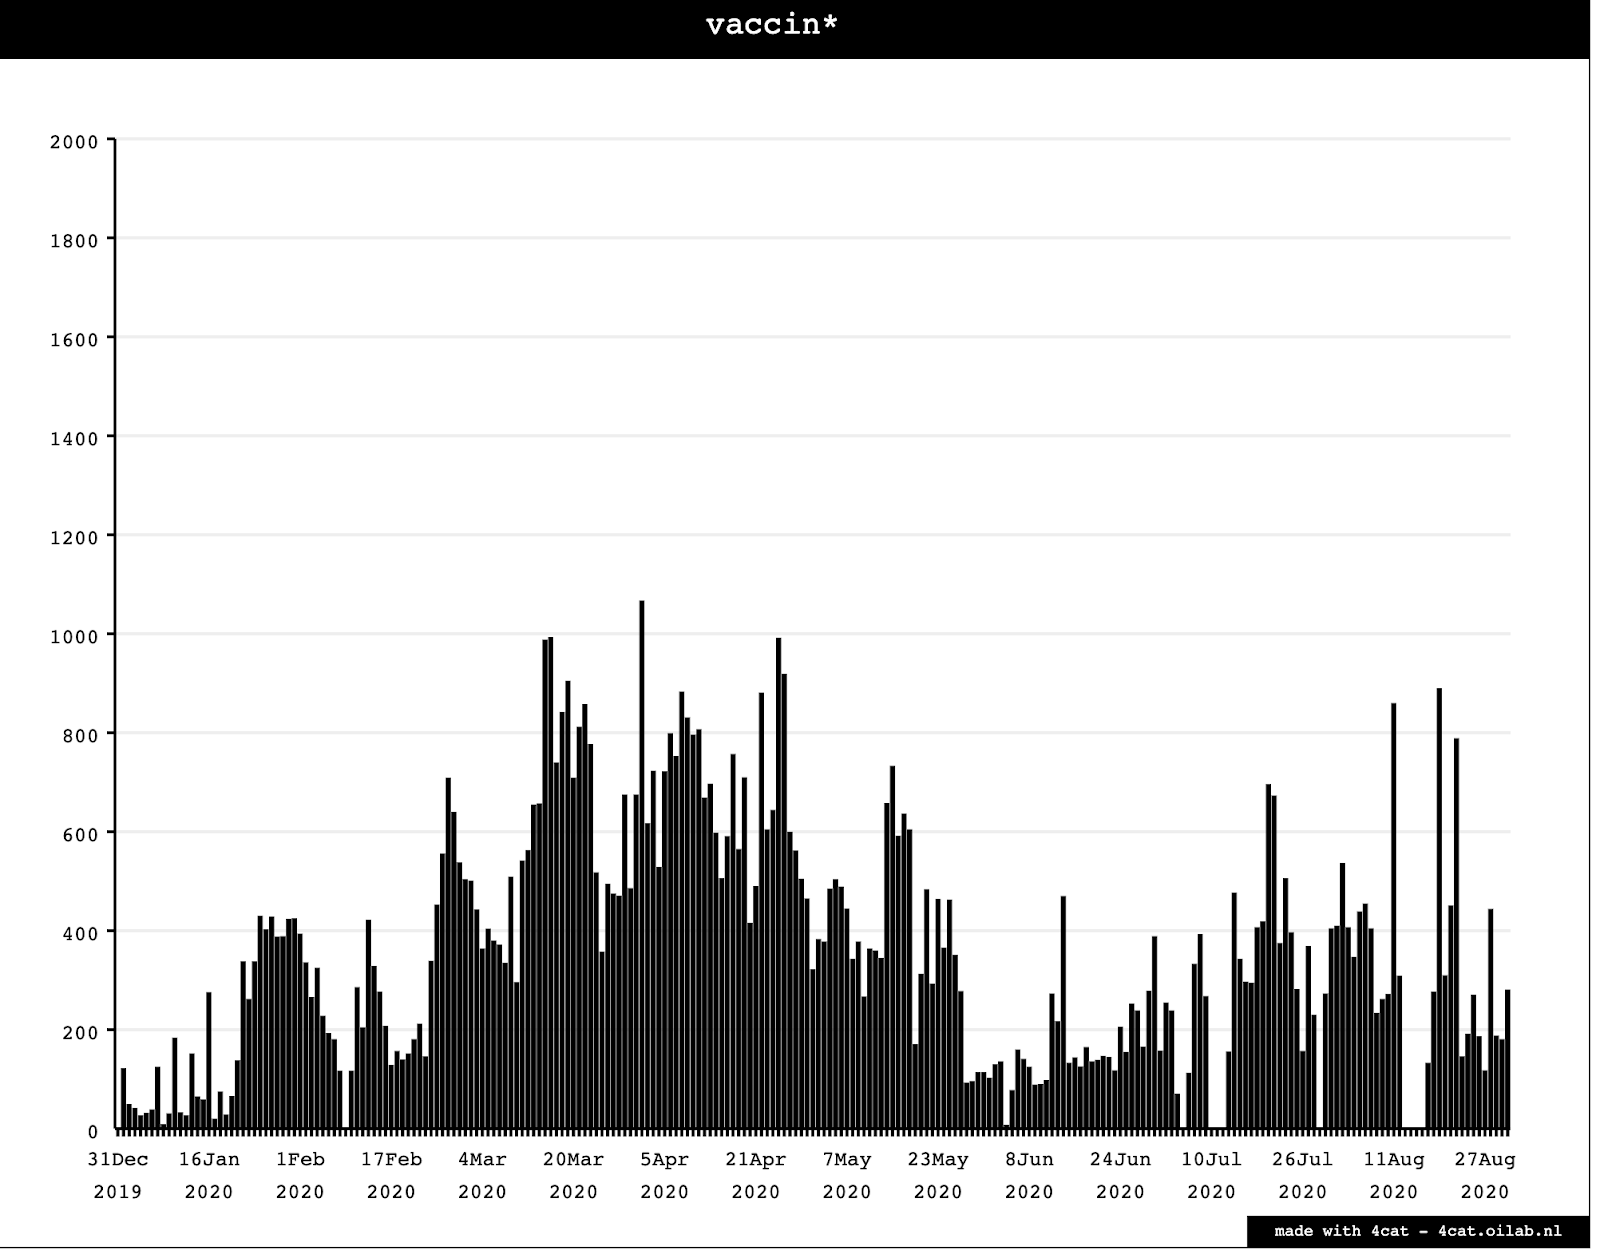
7. Once your results finish, select and then give a title to a “Histogram.” This is a simple bar chart that shows you the number of posts that mentioned your query over time.
8. Open your Histogram as an svg file. Most browsers can handle this format, although for best performance we recommend Chrome.
The resulting histogram shows that discussions about vaccines spiked in mid-April 2020 before petering out and then gaining momentum again in July and August.
9. If you would like to know more about the content of conversations from April or in recent months, download your full Result file.
10. Once you open it, you will be able to scroll through every single post that contains your query — including those published during periods of higher and lower interest in the issue that your query reflects. The screenshot below shows a handful of posts published at the height of debates around COVID vaccines. By manually investigating the dataset — at least portions of it — you will get a good picture of the ideas, resources and main questions users grappled with at different moments in time.
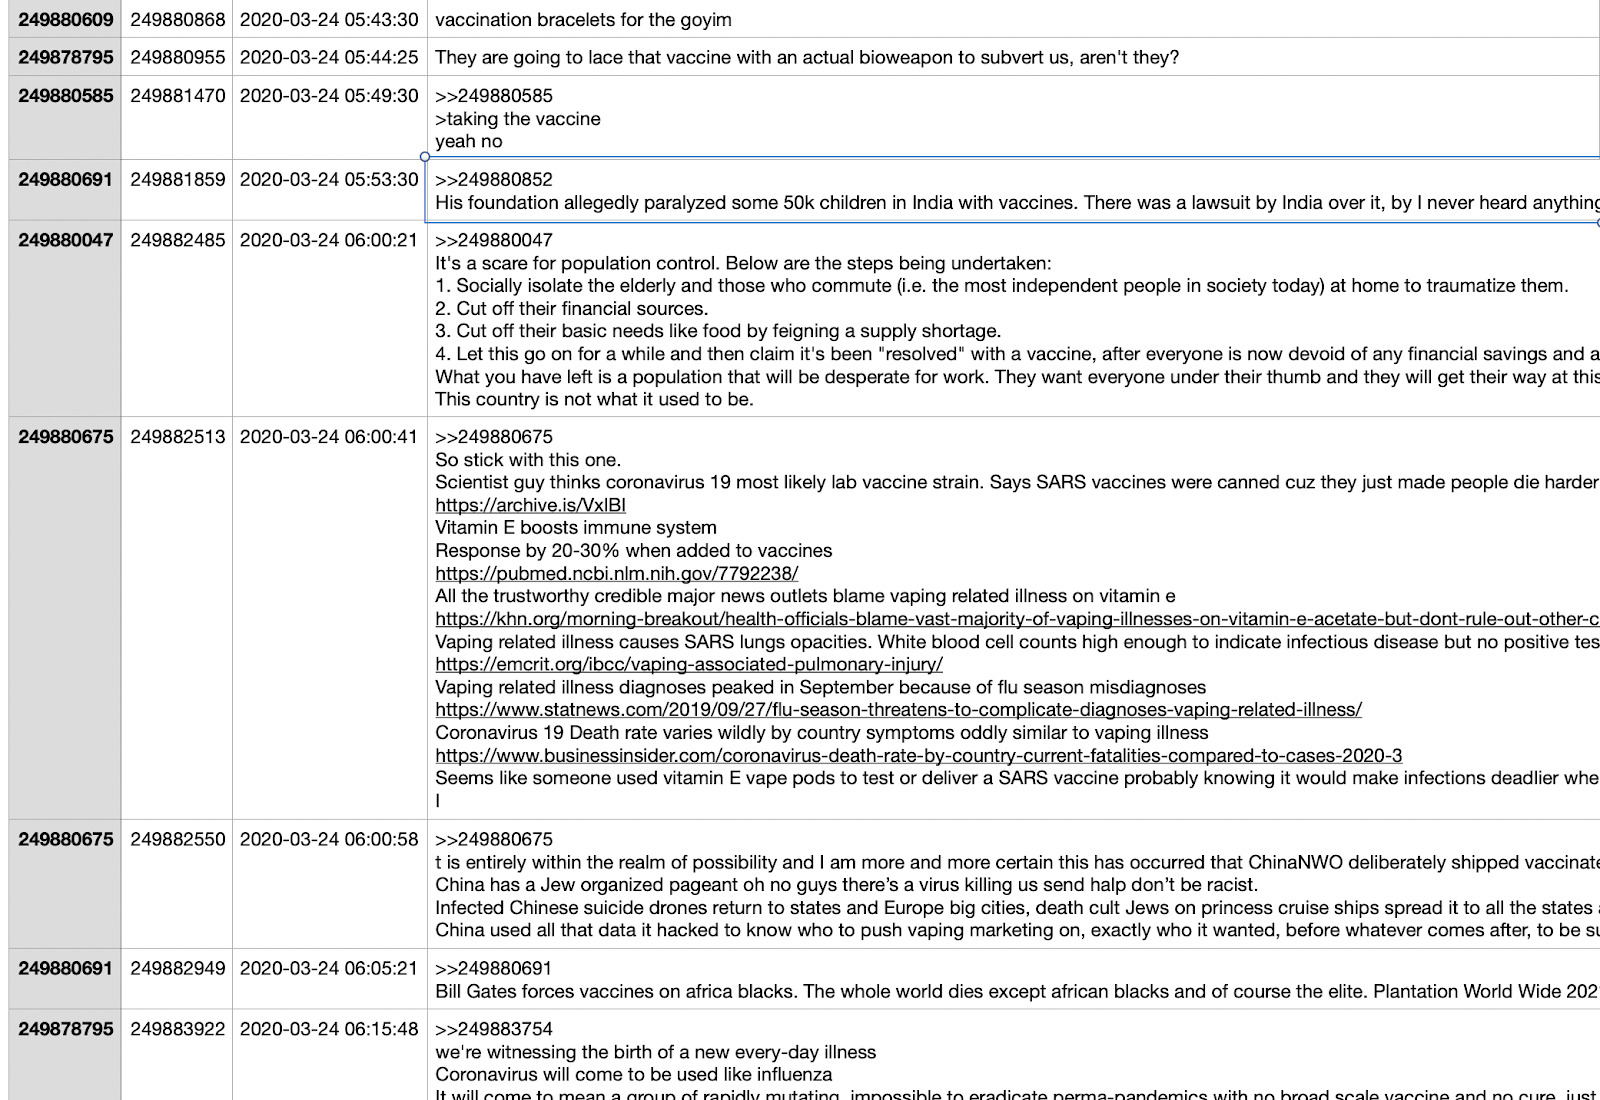
Keep an eye out for in-group vernacular that expresses a belief or reference to misinformation or conspiracy theories around vaccines. You can automate this step using 4CAT’s Extract neologisms tool in the analysis section. This tool finds words that may not be immediately visible outside of 4chan, but are used by particular “in-groups.” You can find more information about the tool in the recipe How to find misleading YouTube videos on fringe platforms. This is an important step, because our original query (vaccin*) was both neutral and general and may turn up many innocuous posts we may not be interested in. But upon manually inspecting the dataset, you can see that many users speak about population control and Bill Gates in reference to a Covid-19 vaccine while others discuss the effectiveness of hydroxychloroquine as an alternative treatment.
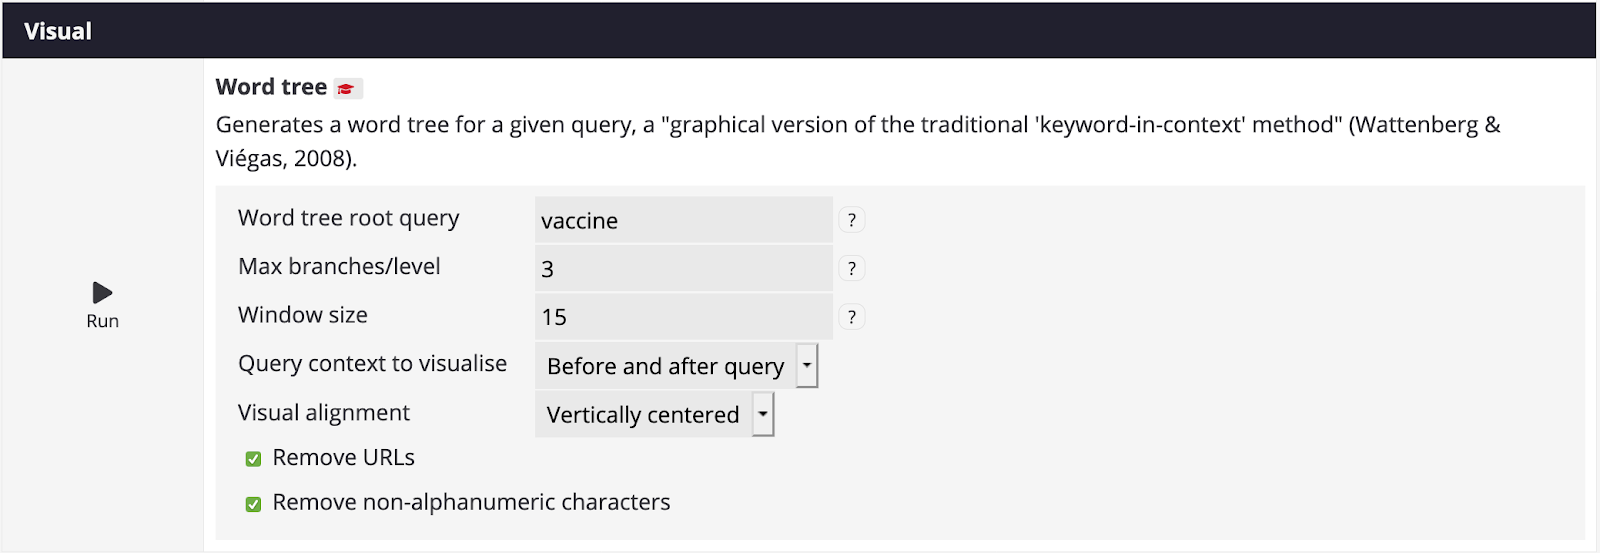
11. To gain a sense of actively problematic terms, you can try zooming into words that are frequently associated to your original (neutral) query (“vaccin*”). 4CAT has different ways of finding frequently associated words: with word embeddings, word collocations, word2vec and word trees. Let’s first try word trees. Depending on how big our dataset is (>100,000 rows), we may also try word2vec, which finds word associations in large bodies of text.
12. At the very bottom of the page, run the word tree module by indicating the keyword or root query you want to see mapped. You can choose to see sentences preceding or following that word, and you can also indicate how long you would like those sentences to be (window size). We have chosen a window size of 15.
When done, your SVG result should look like this:
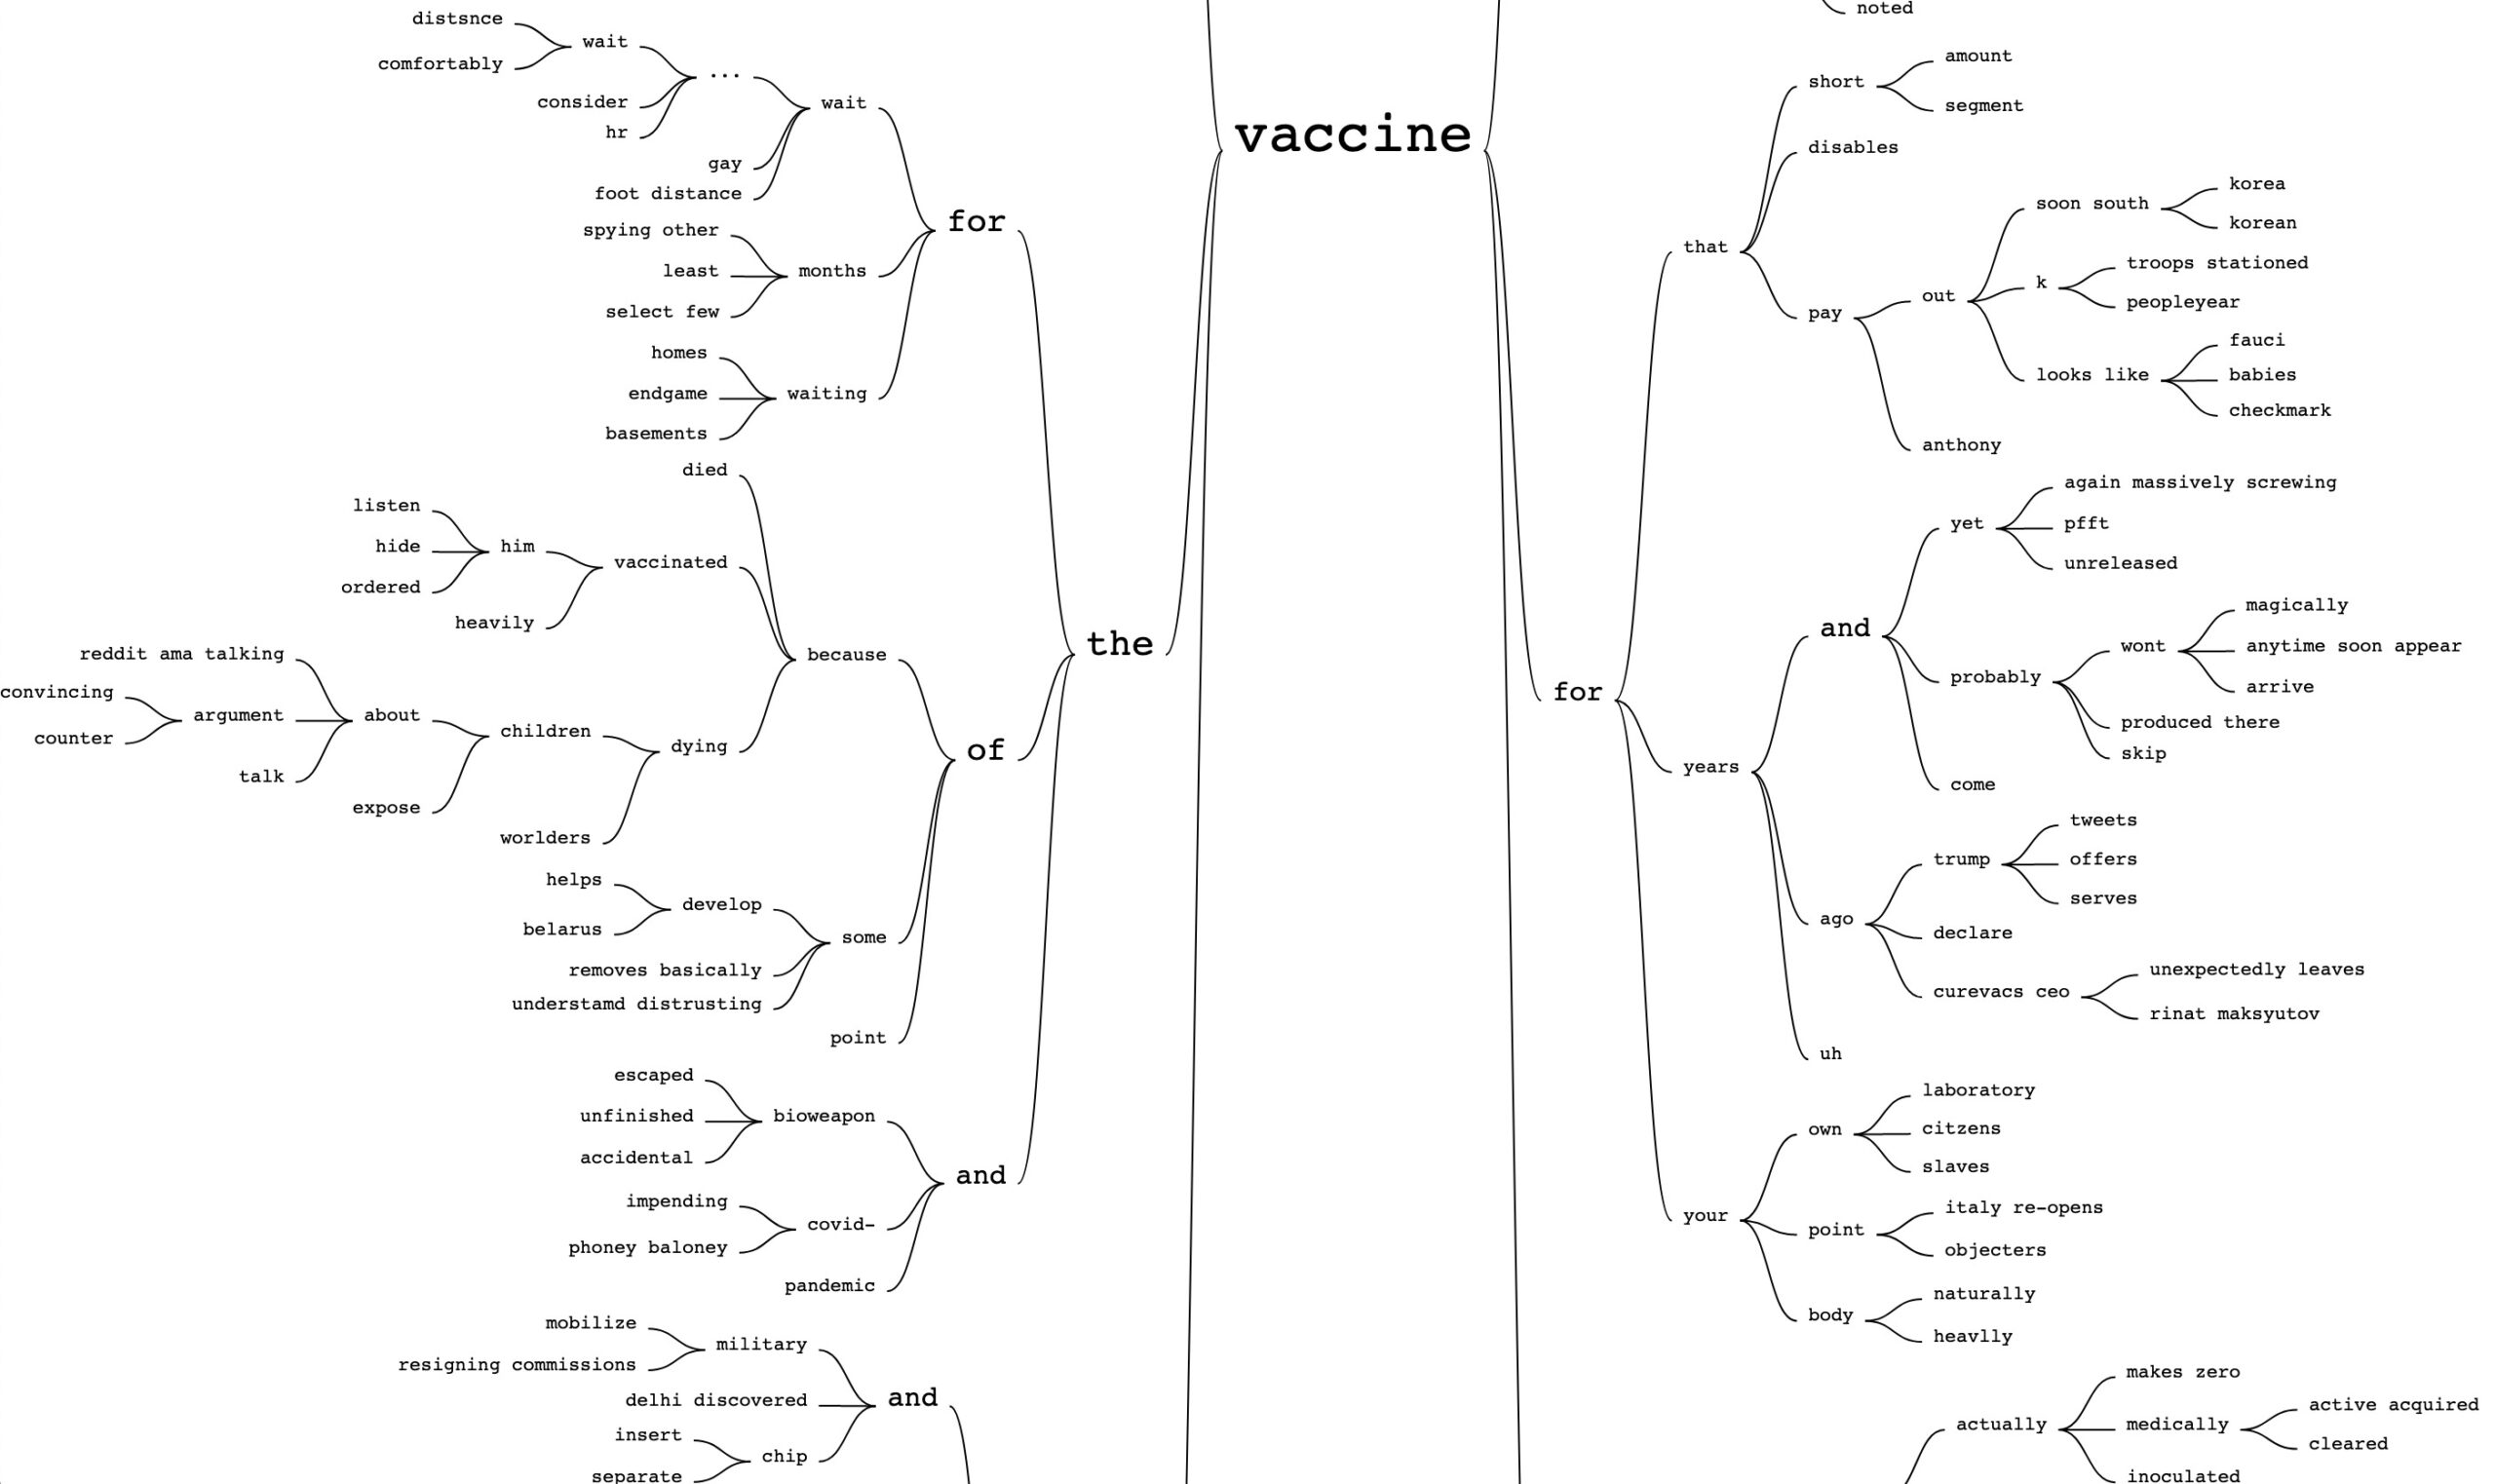
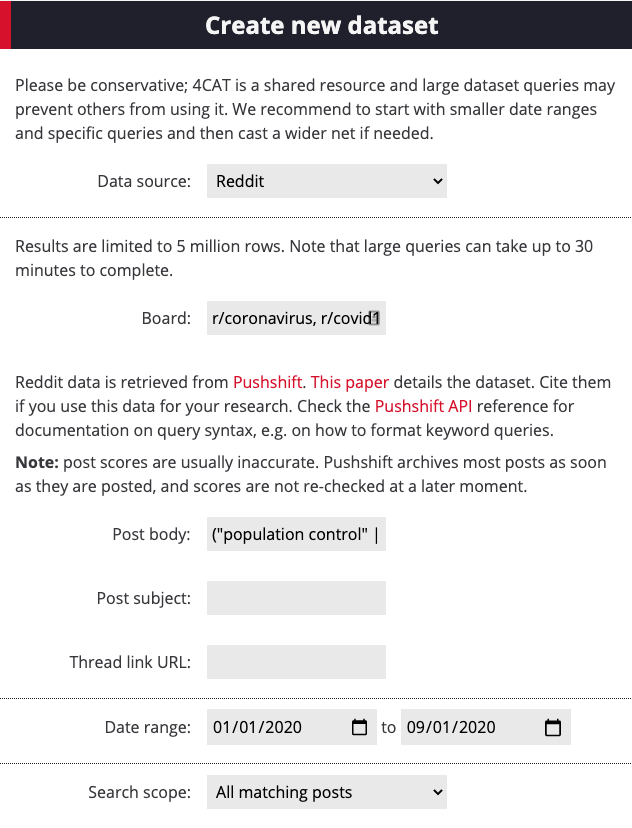
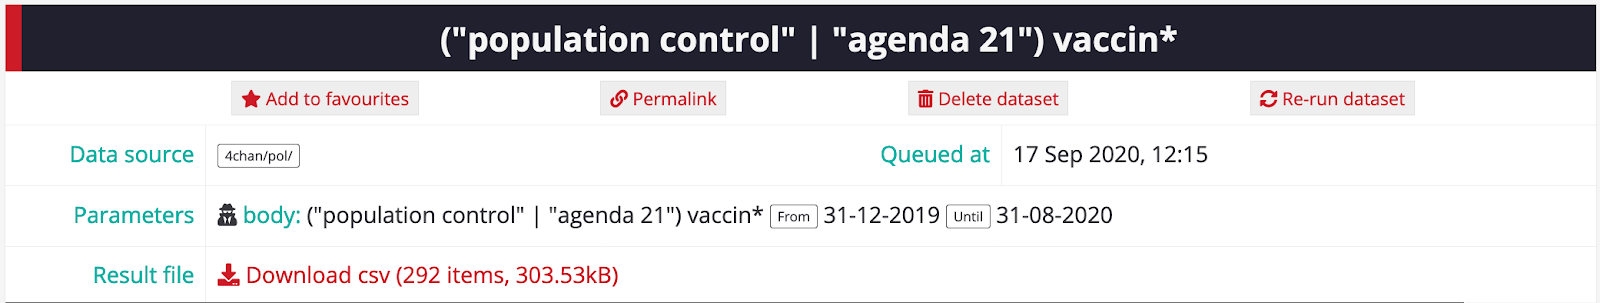
13. From alternations of this treemap and close readings of post results, we find one recurring narrative: that vaccines are part of a top-down effort to control population numbers, particularly in connection to a so-called “Agenda 21.” Where did the connection between COVID vaccines and population control come from? Let’s explore this question using all parts of this narrative: (“population control” | “agenda 21”) vaccin* as a new query. Go back to the Create dataset page and query 4chan, 8kun and subreddits with this query.
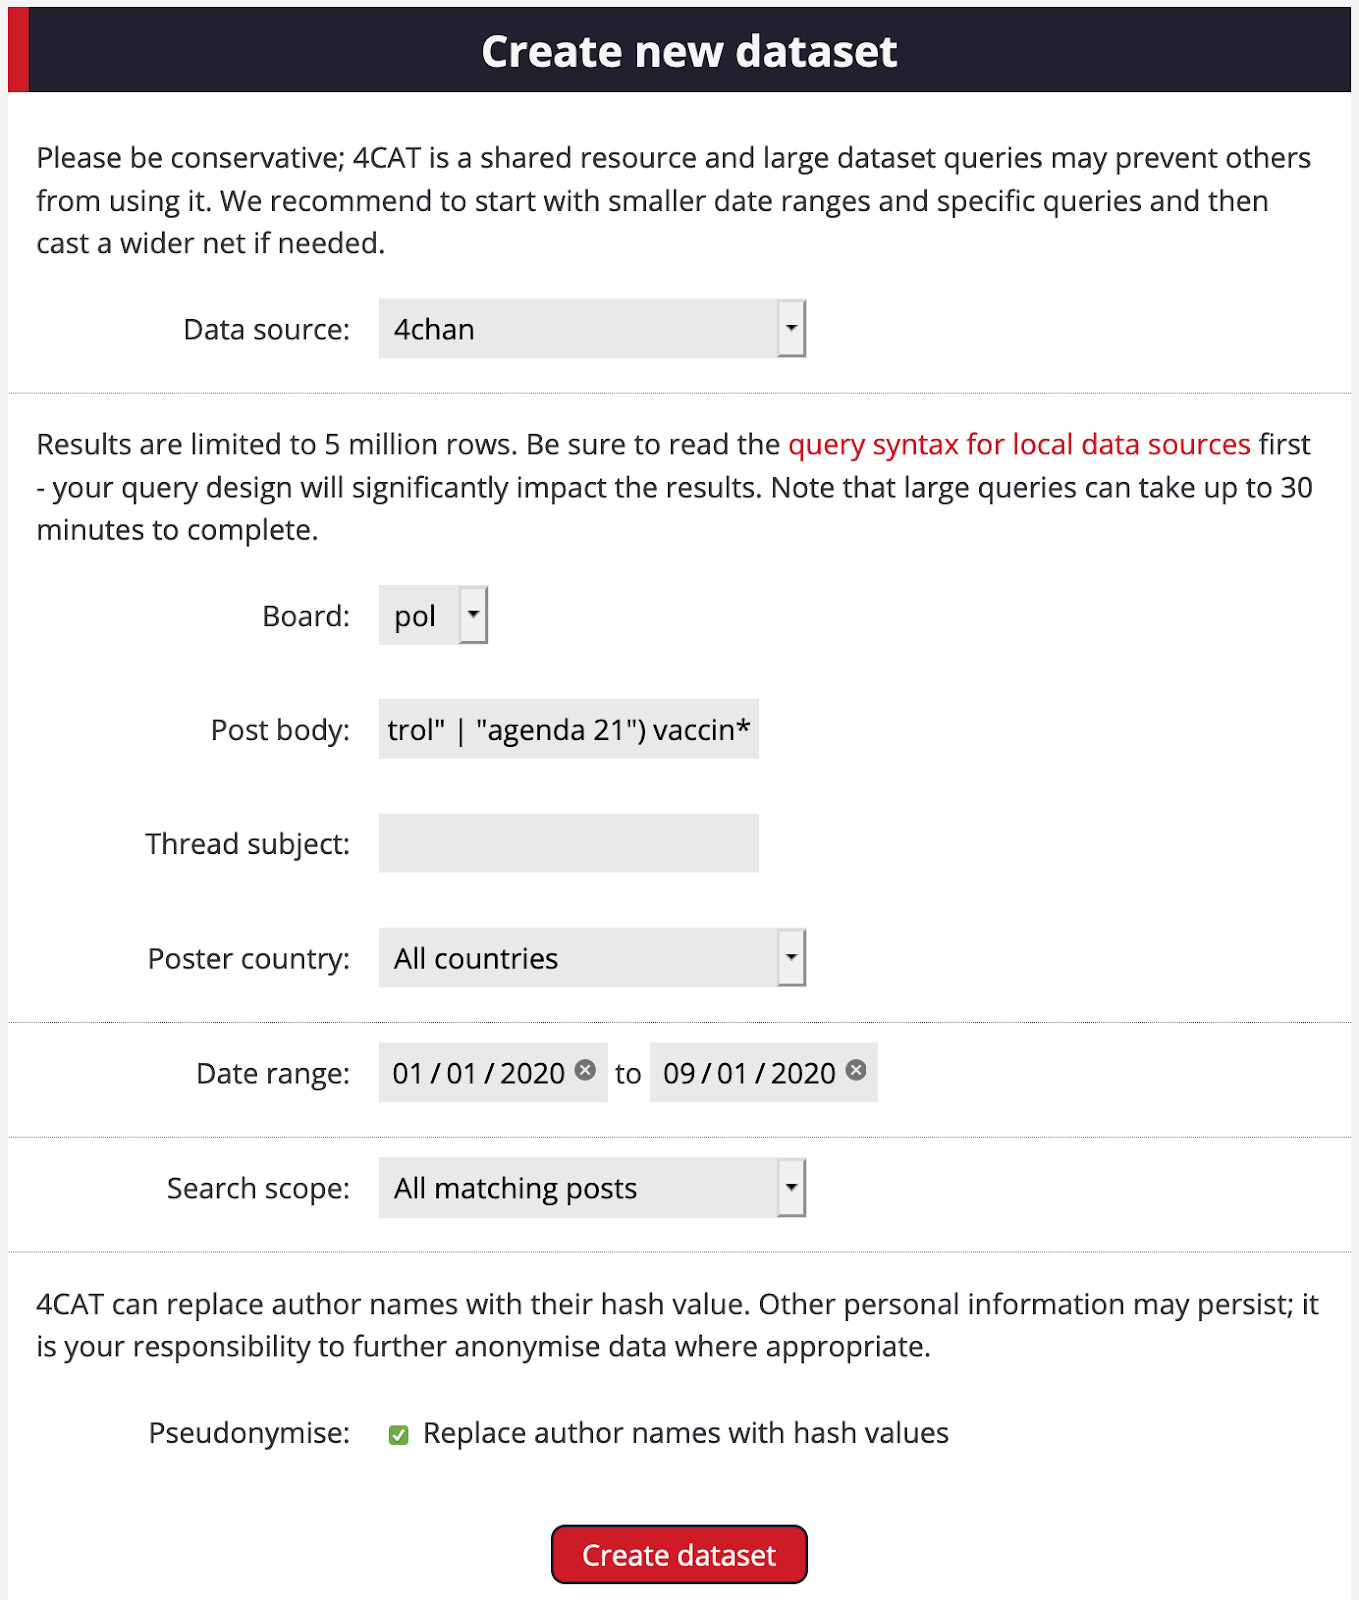
? Please note: you will need to use a different query syntax for Reddit. We first used: vaccine “population control” and then stacked results with vaccine “agenda 21.”
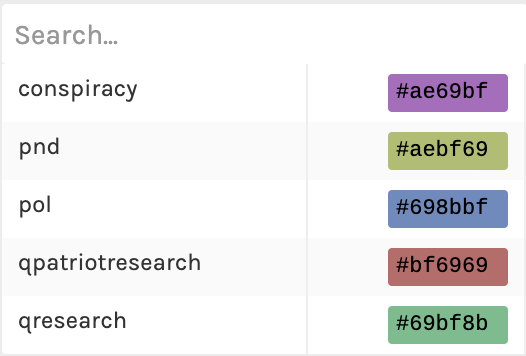
As specified above, we are querying the subreddits r/coronavirus, r/covid19, r/chinaflu and r/conspiracies. We also tried four of 8kun’s boards: pnd, qresearch, qpatriotresearch and qresearch2gen.
14. Once you have obtained all datasets, go to each of their Analysis pages and select Count posts. Then, open and download the main resulting files for each platform: the CSV called “Result file”.
15. Then, in an empty spreadsheet, copy the columns that your datasets have in common (e.g., timestamp, body, subreddit or board, and ID). Add one or two extra columns to indicate which platform the data originates from: 4chan, 8chan, 8kun, Reddit, as well as their boards or subreddits: r/coronavirus, r/covid19, pnd, qresearch. Your copied contents should be stacked on top of each other.
? Feel free to add an extra column for any valuable information or pattern you may have found while manually analyzing your dataset, particularly commonalities. We may notice, for example, that 4chan and 8kun users use certain kinds of evidence seldom found on Reddit. We could then create an extra column for every post that contains URLs or any other piece of information users see as evidence.
16. Make sure to standardize the timestamp column.
17. Copy and paste your entire dataset on Raw Graphs.
? If Raw Graphs returns an error after pasting your data, try saving your spreadsheet as a CSV and uploading it instead as a file.
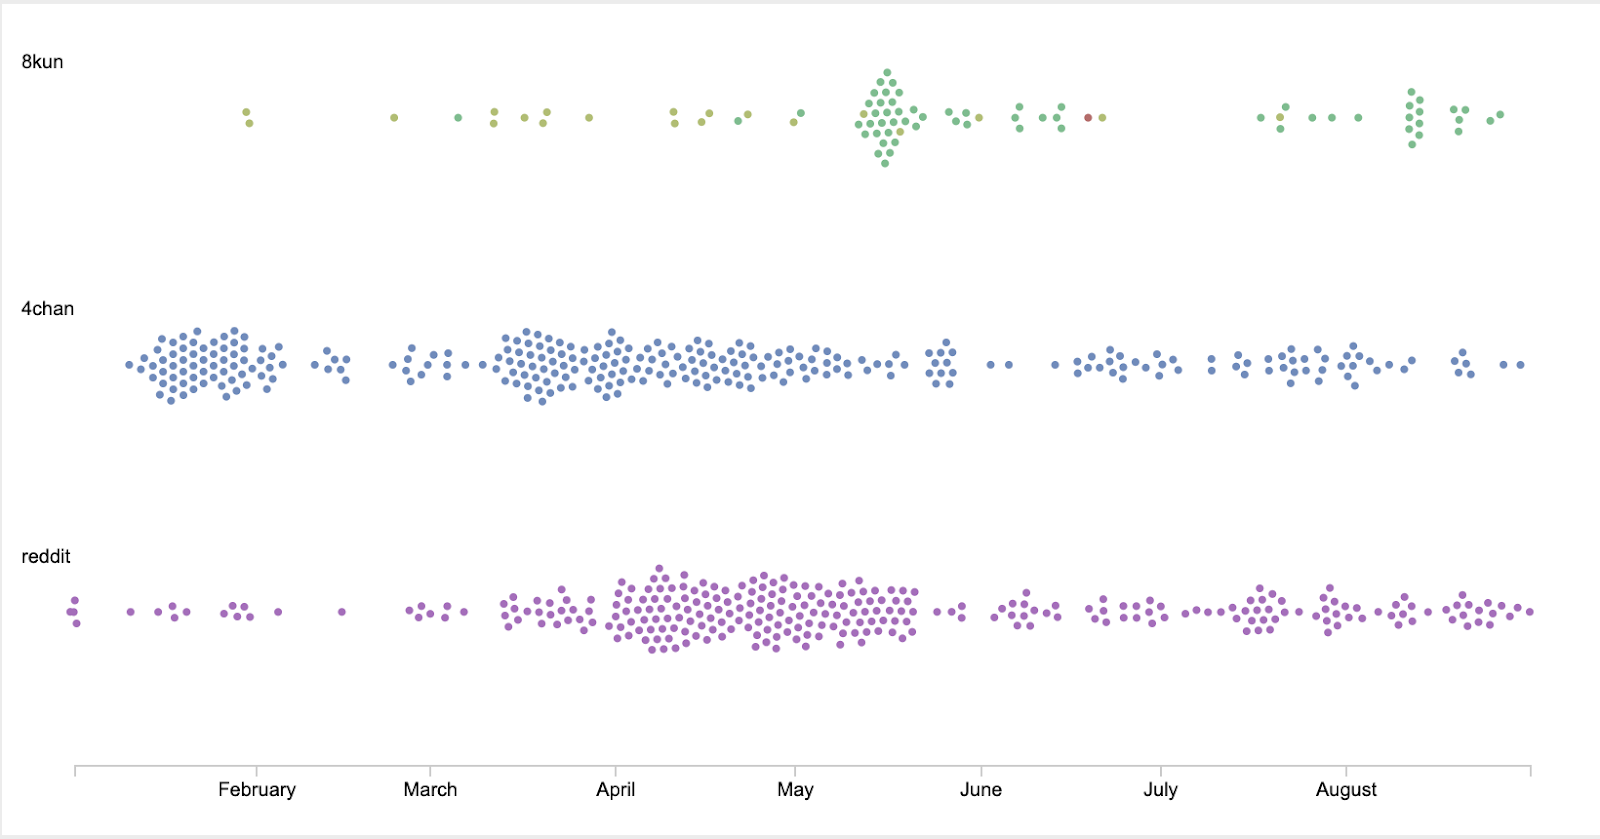
18. Once it’s uploaded, choose a time series or distribution graph, like the Beeswarm.
? Time series normalize individual posts as an overall mass over time, while dispersion plots will show you every single individual data unit, if selected.
19. On a Beeswarm, place “platform” under Groups, “board” under Color, and “timestamp” under X axis.
20. The resulting visualization shows us that the r/conspiracy board was one of the first places where users began to speak about vaccines, population control and “Agenda 21” in the context of the COVID pandemic. 4chan/pol reignited these discussions in late January, and was then followed by Reddit and 8kun by April. It also shows that qresearch was the board where the majority of these discussions took place on 8kun.
21. We can also annotate our final visualization based on close readings of our original datasets. You can download your visualization as an SVG and open it in Adobe Illustrator or other image editors you may use.
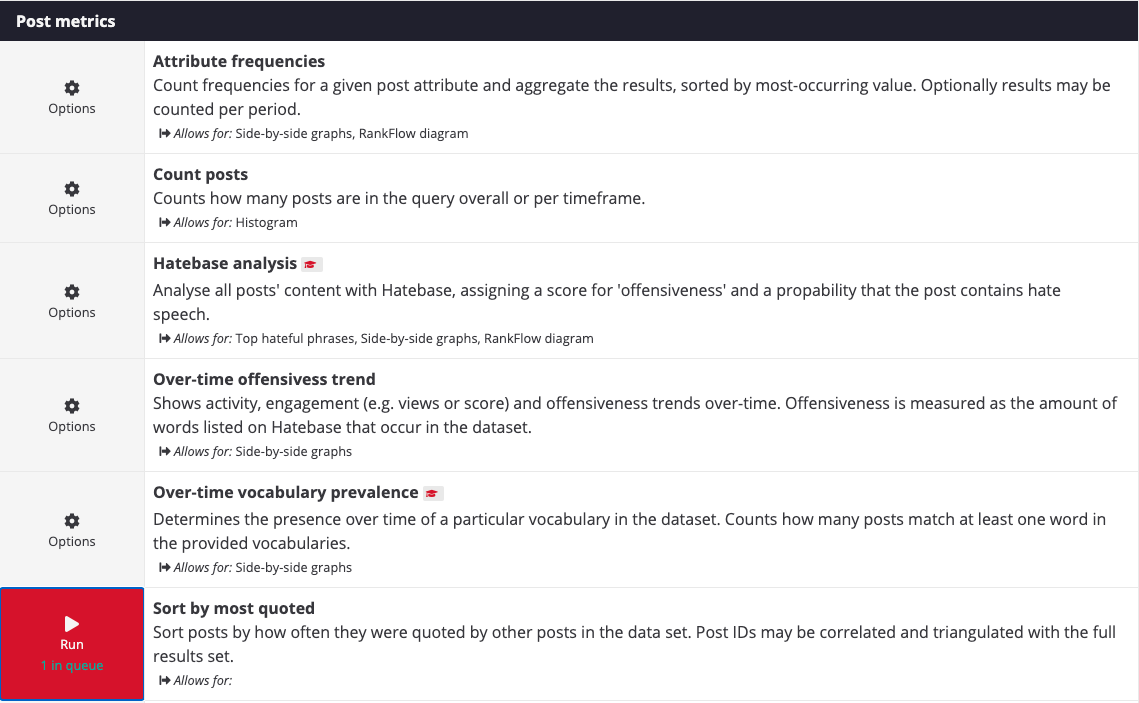
22. If you want your graph to be more detailed, or include different engagement metrics, copy and paste those additional columns from your original CSVs. Your original Reddit result file (see Step 11) will contain a column named “Score”. You may copy and paste that column, alongside the columns “timestamp” and “body”, in a new spreadsheet file. Though there are many ways of conceptualizing “engagement” on 4chan and 8kun, 4CAT captures the number of times a post was quoted by other users. You may collect this information under Analysis >> Post metrics >> Sort by most quoted. This will rank your 4chan and 8kun posts by the number of times they were quoted, which will appear in the column num_quoted of the resulting CSV.
23. Again, stack up your results together, indicating the platforms from which they originate.
24. On a Beeswarm, use columns like “score” (which, on Reddit, indicate engagement metrics) as Radius. This will allow you to see posts that have gathered the most engagement.
Like the other recipes, you can use all of the steps for a particular investigation, or you can cherry-pick the sections and tools most relevant to the story you are working on. These steps outline one way to use these tools to carry out an investigation. But this is certainly not the only way. All of the recipes, including the one above, are flexible, encouraging journalists and researchers to be creative and think outside the box when using these recipes to investigate online misinformation.
Emillie de Keulenaar is a PhD researcher at University of Amsterdam’s Open Intelligence Lab and Simon Fraser University’s Digital Democracies group. She has previously researched with the UN’s Innovation Cell, the Dutch digital humanities cluster CLARIAH, the European Time Machine consortium and the Clingendael Institute. Her interests lie in the role of deep disagreements in producing misinformation, as well as in the history of moderating online hate speech and other problematic information.
Stay up to date with First Draft’s work by becoming a subscriber and following us on Facebook and Twitter.