As coronavirus misinformation continues to spread, knowing some basic methods for collecting and analyzing data is essential for journalists and researchers who want to dive under the surface of online information patterns.
There is a mountain of data that can help us examine topics such as the spread of 5G conspiracy theories or where false narratives around Covid-19 cures came from. It can help us analyze cross-border narratives and identify which online communities most frequently discuss certain issues.
While Twitter’s public data is accessible through its Application Programming Interface (API), it can be much more complicated for researchers to access platforms such as Facebook and Instagram.
Facebook-owned platform CrowdTangle is the most easily accessible tool to handle three of the most important social networks — Facebook, Instagram, and Reddit — and it is free for journalists and researchers.
What is CrowdTangle?
CrowdTangle is an enormous archive of social media data that allows us to search through public Instagram, Facebook and Reddit posts or organise public accounts and communities into lists.
Here are a few things we can do easily with CrowdTangle:
- Monitor what is trending around a certain topic
- Search for combinations of words and phrases to discover trends and patterns.
- Track the activity of public accounts and communities.
- See which accounts are posting most and who is getting the most interactions around certain issues.
Read our Newsgathering and Monitoring guide to learn more on how to monitor disinformation on CrowdTangle.
There are some limitations however. The data is not exhaustive and you can only access content that is already publicly available — meaning we can’t see posts published within private groups or by private profiles.
We can also only track the activity of those accounts which are already included in the CrowdTangle database. CrowdTangle have made great efforts to ensure the database is comprehensive but it is not perfect. Nevertheless, it’s the best option we have to access historical data on these platforms, measure trends and find patterns.
It is also useful in helping us decide whether a rumor has crossed the tipping point and entered into the public eye, making it a prime candidate for reporting to stem the spread of misinformation, rather than amplifying something few have seen.
Download the data
If you don’t already have access to CrowdTangle, you can request it through its website. It is free for journalists and researchers.
There are a few different options available for accessing public posts in a data-friendly format, mainly through ‘Historical Data’ (under ‘General Settings’, on the top-right corner) or through the ‘Saved Searches’ feature. We’ll illustrate the latter as it allows us to tailor the search according to a broader range of keywords or phrases.
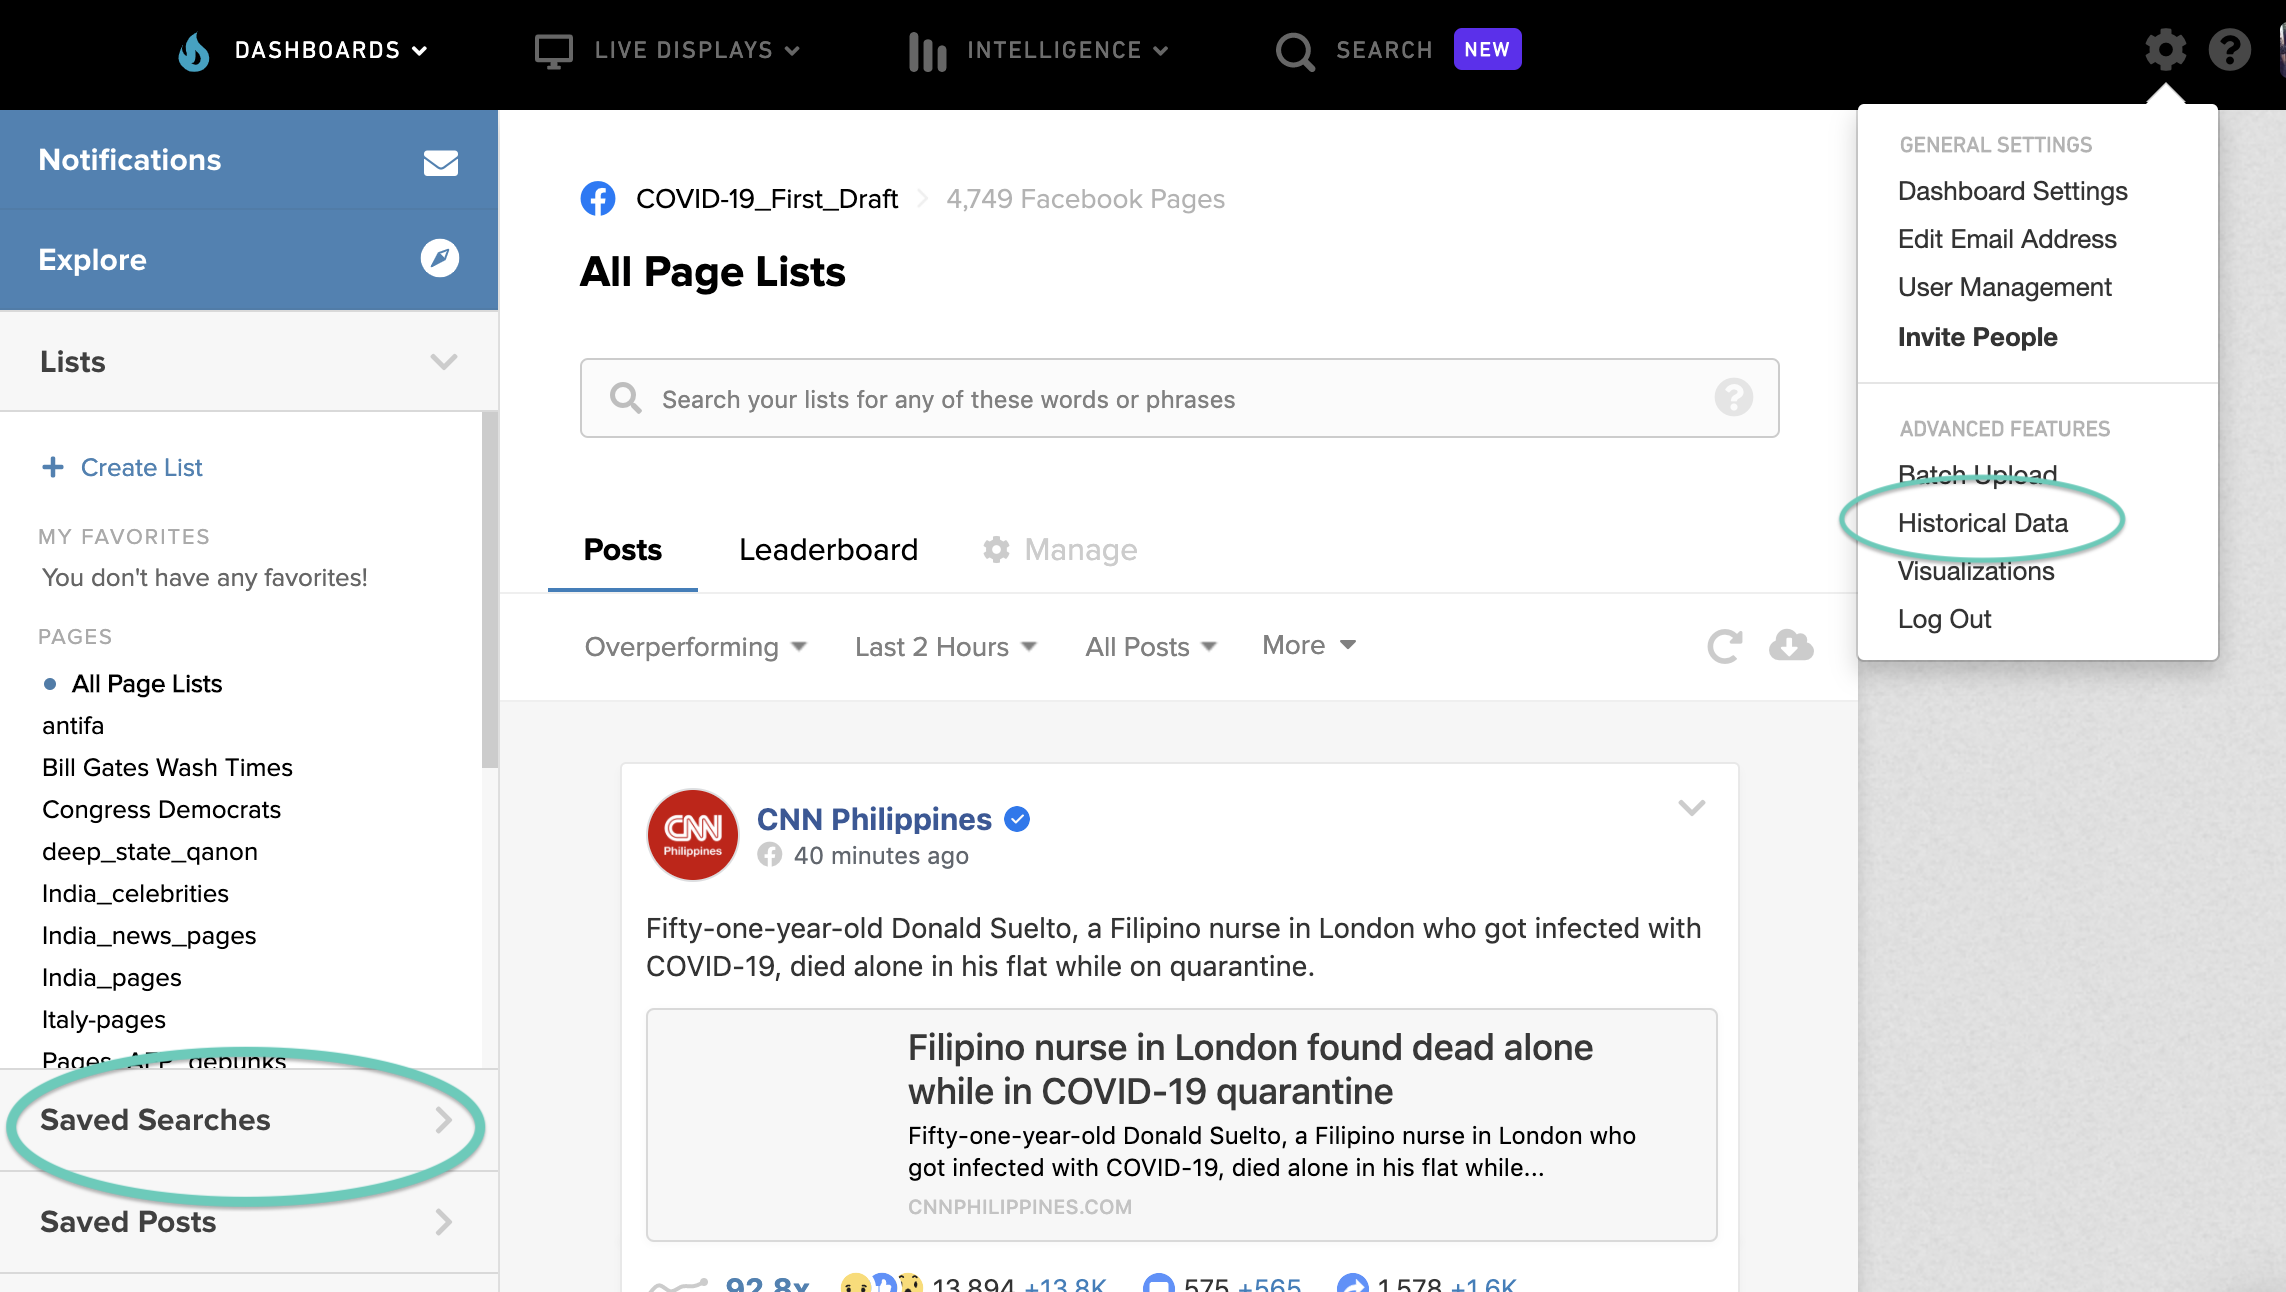
Saved searches and historical data on CrowdTangle.
On the CrowdTangle dashboard page, go to ‘Saves Searches’, click on ‘New Search’ and then on ‘Edit Search’ to input more advanced queries. Unfortunately, we can’t search on both Facebook Pages and Groups at the same time, so we have to choose where we want to search or repeat the same steps twice.
We can use a list of keywords and the CrowdTangle version of Boolean expressions.
In the following example, we used the ‘Saved Searches’ feature to search trends around the false claim that 5G causes Covid-19 when it started trending on social media.
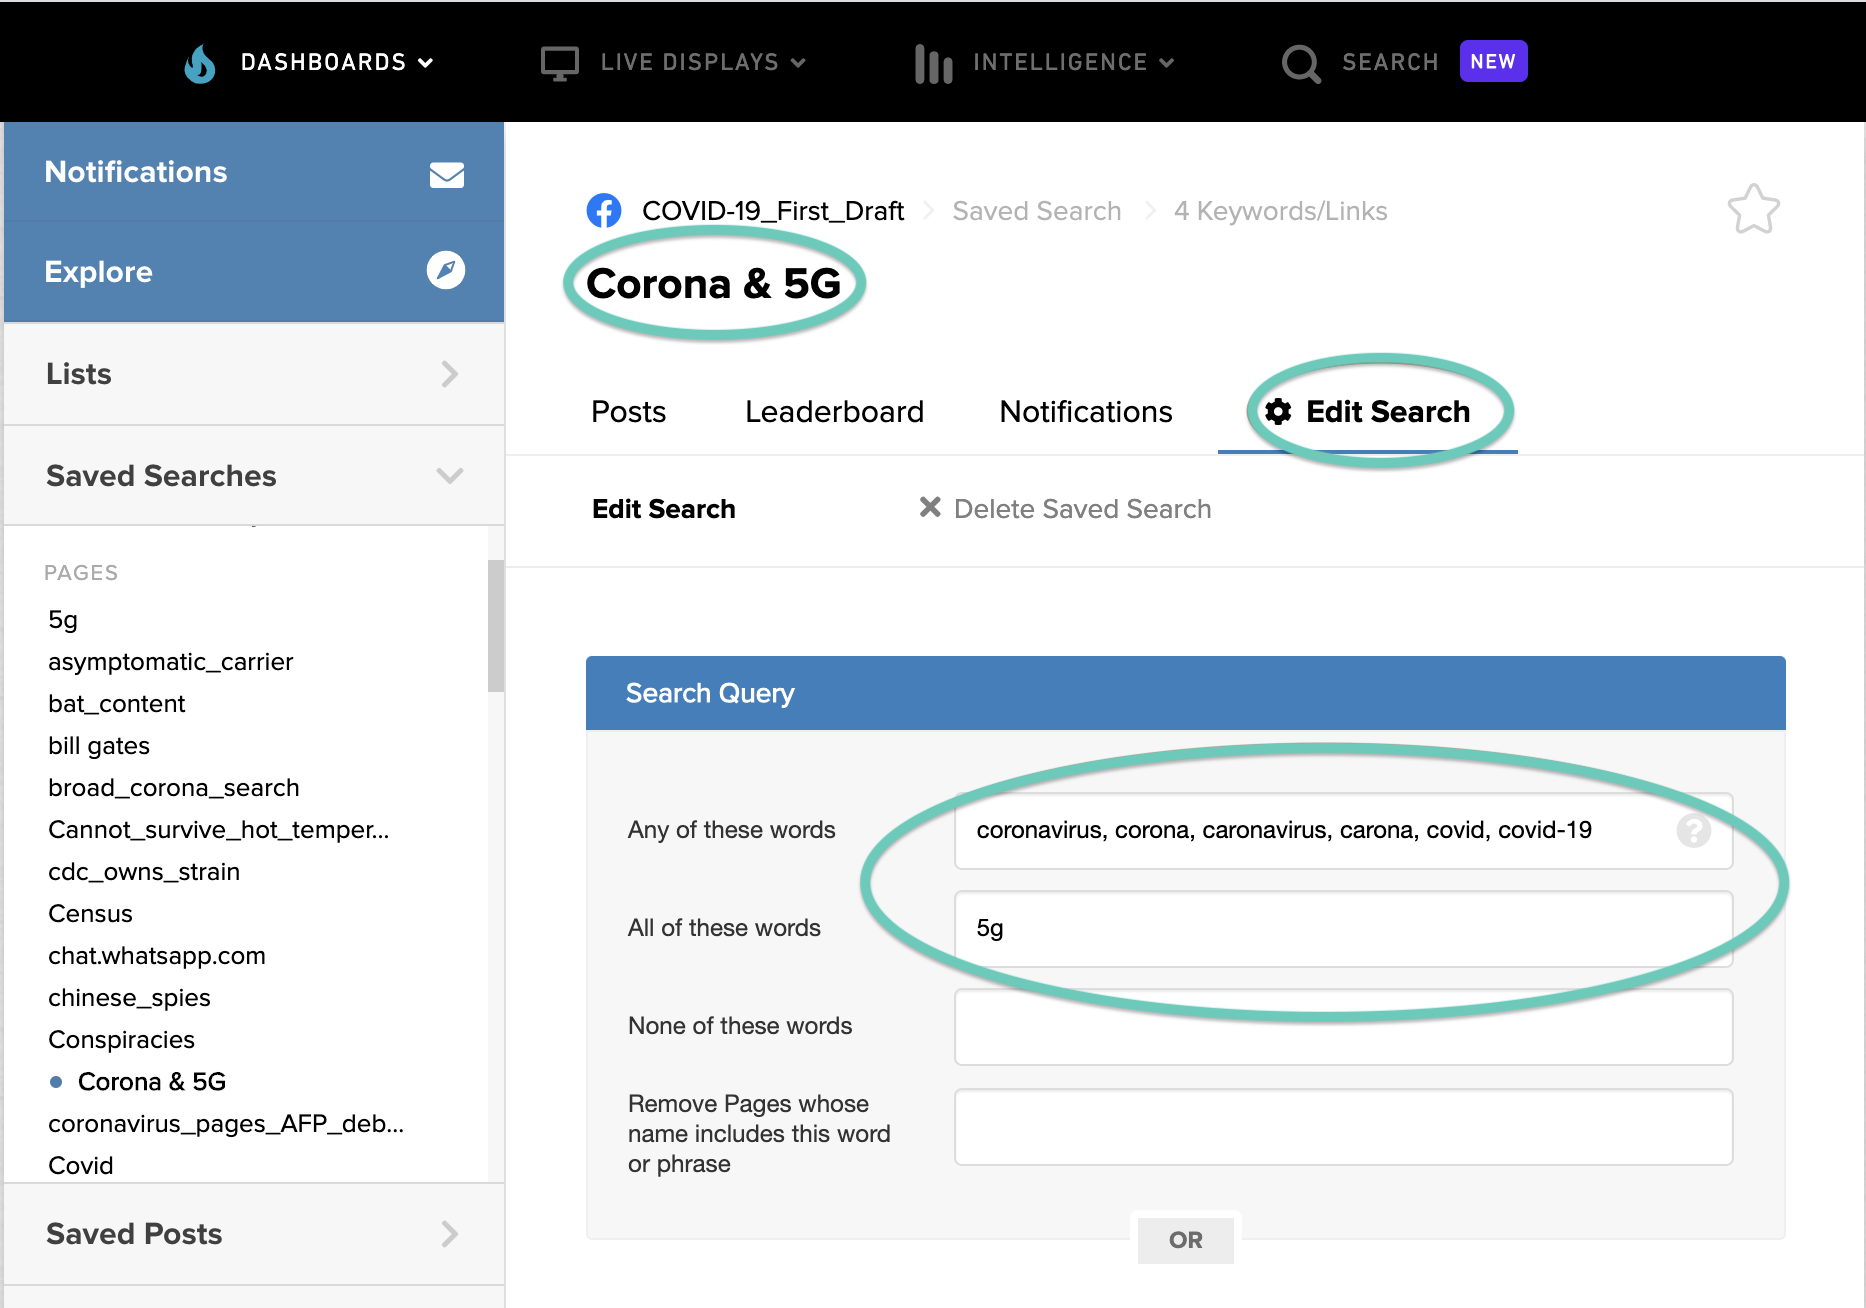
‘Saved Searches’ feature to search trends around the false claim that 5G.
In the first search query, below, we are asking CrowdTangle to search its database of Facebook Pages for posts containing one of a number of variations on “coronavirus” and “5G”. We can input here any word we think people might use instead of “Coronavirus”, including misspellings. Remember it is important to think about the language that people use on social media.
We can then add similar queries an unlimited number of times.
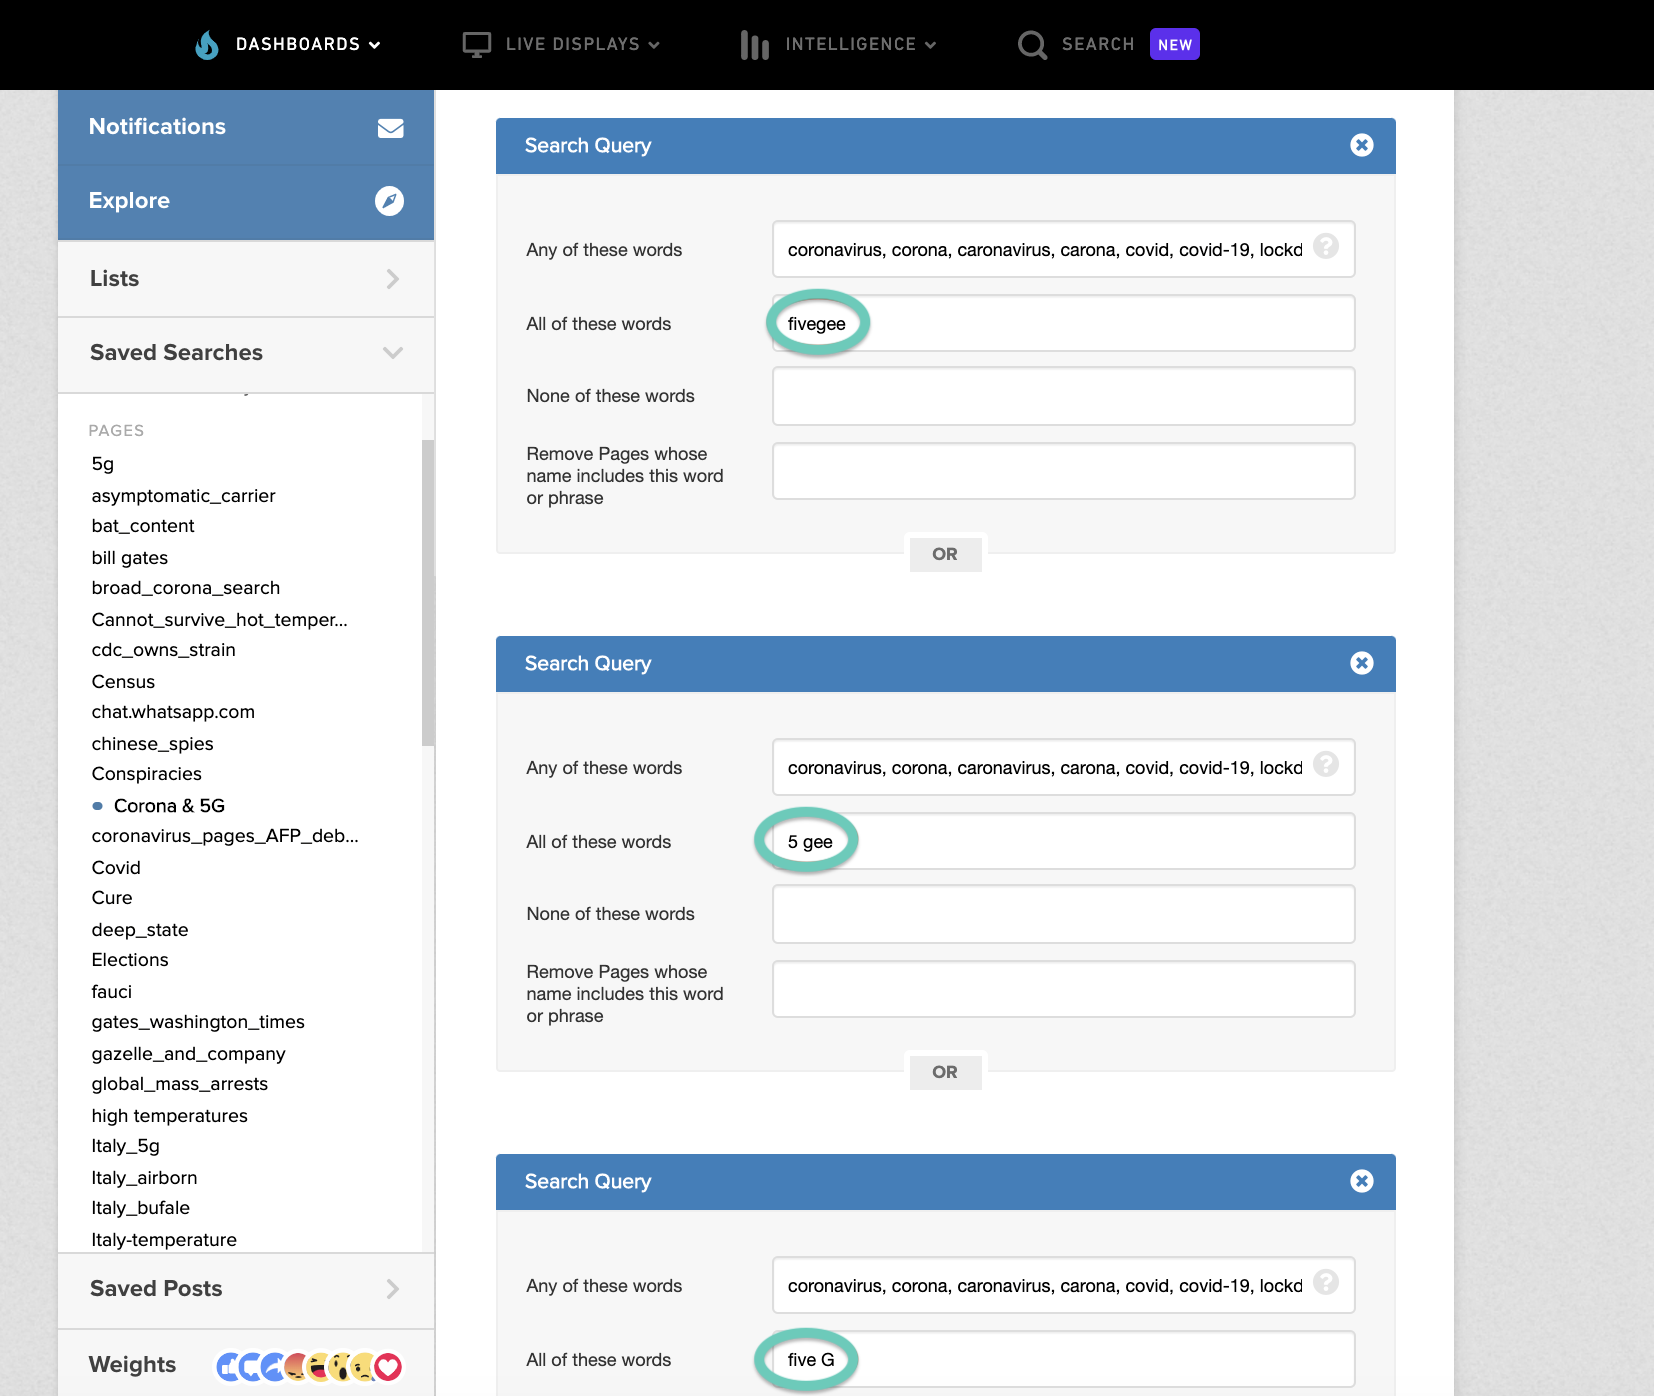
Search queries in CrowdTangle aren’t always straightforward but are powerful.
Doing this as a normal Boolean search, of the kind we might use on Twitter, would look something like this:
(coronavirus OR corona OR caronavirus OR carona OR covid OR covid-19) AND (5g OR fivegee OR “5 gee” OR “five G”)
While CrowdTangle’s new Search feature does accept Boolean queries, the dashboard and saved searches like this do not.
So for CT searches you basically have to repeat:
(coronavirus OR corona OR caronavirus OR carona OR covid OR covid-19) AND 5g
(coronavirus OR corona OR caronavirus OR carona OR covid OR covid-19) AND “5 gee”
And so on. With CrowdTangle you can just replace all the “OR” operators with a comma.
After inputting the search queries, it’s time to set filters, like language, timeframe, media type and more.
In our 5G search, for example, we set a timeframe from Jan 1 up to April 16.
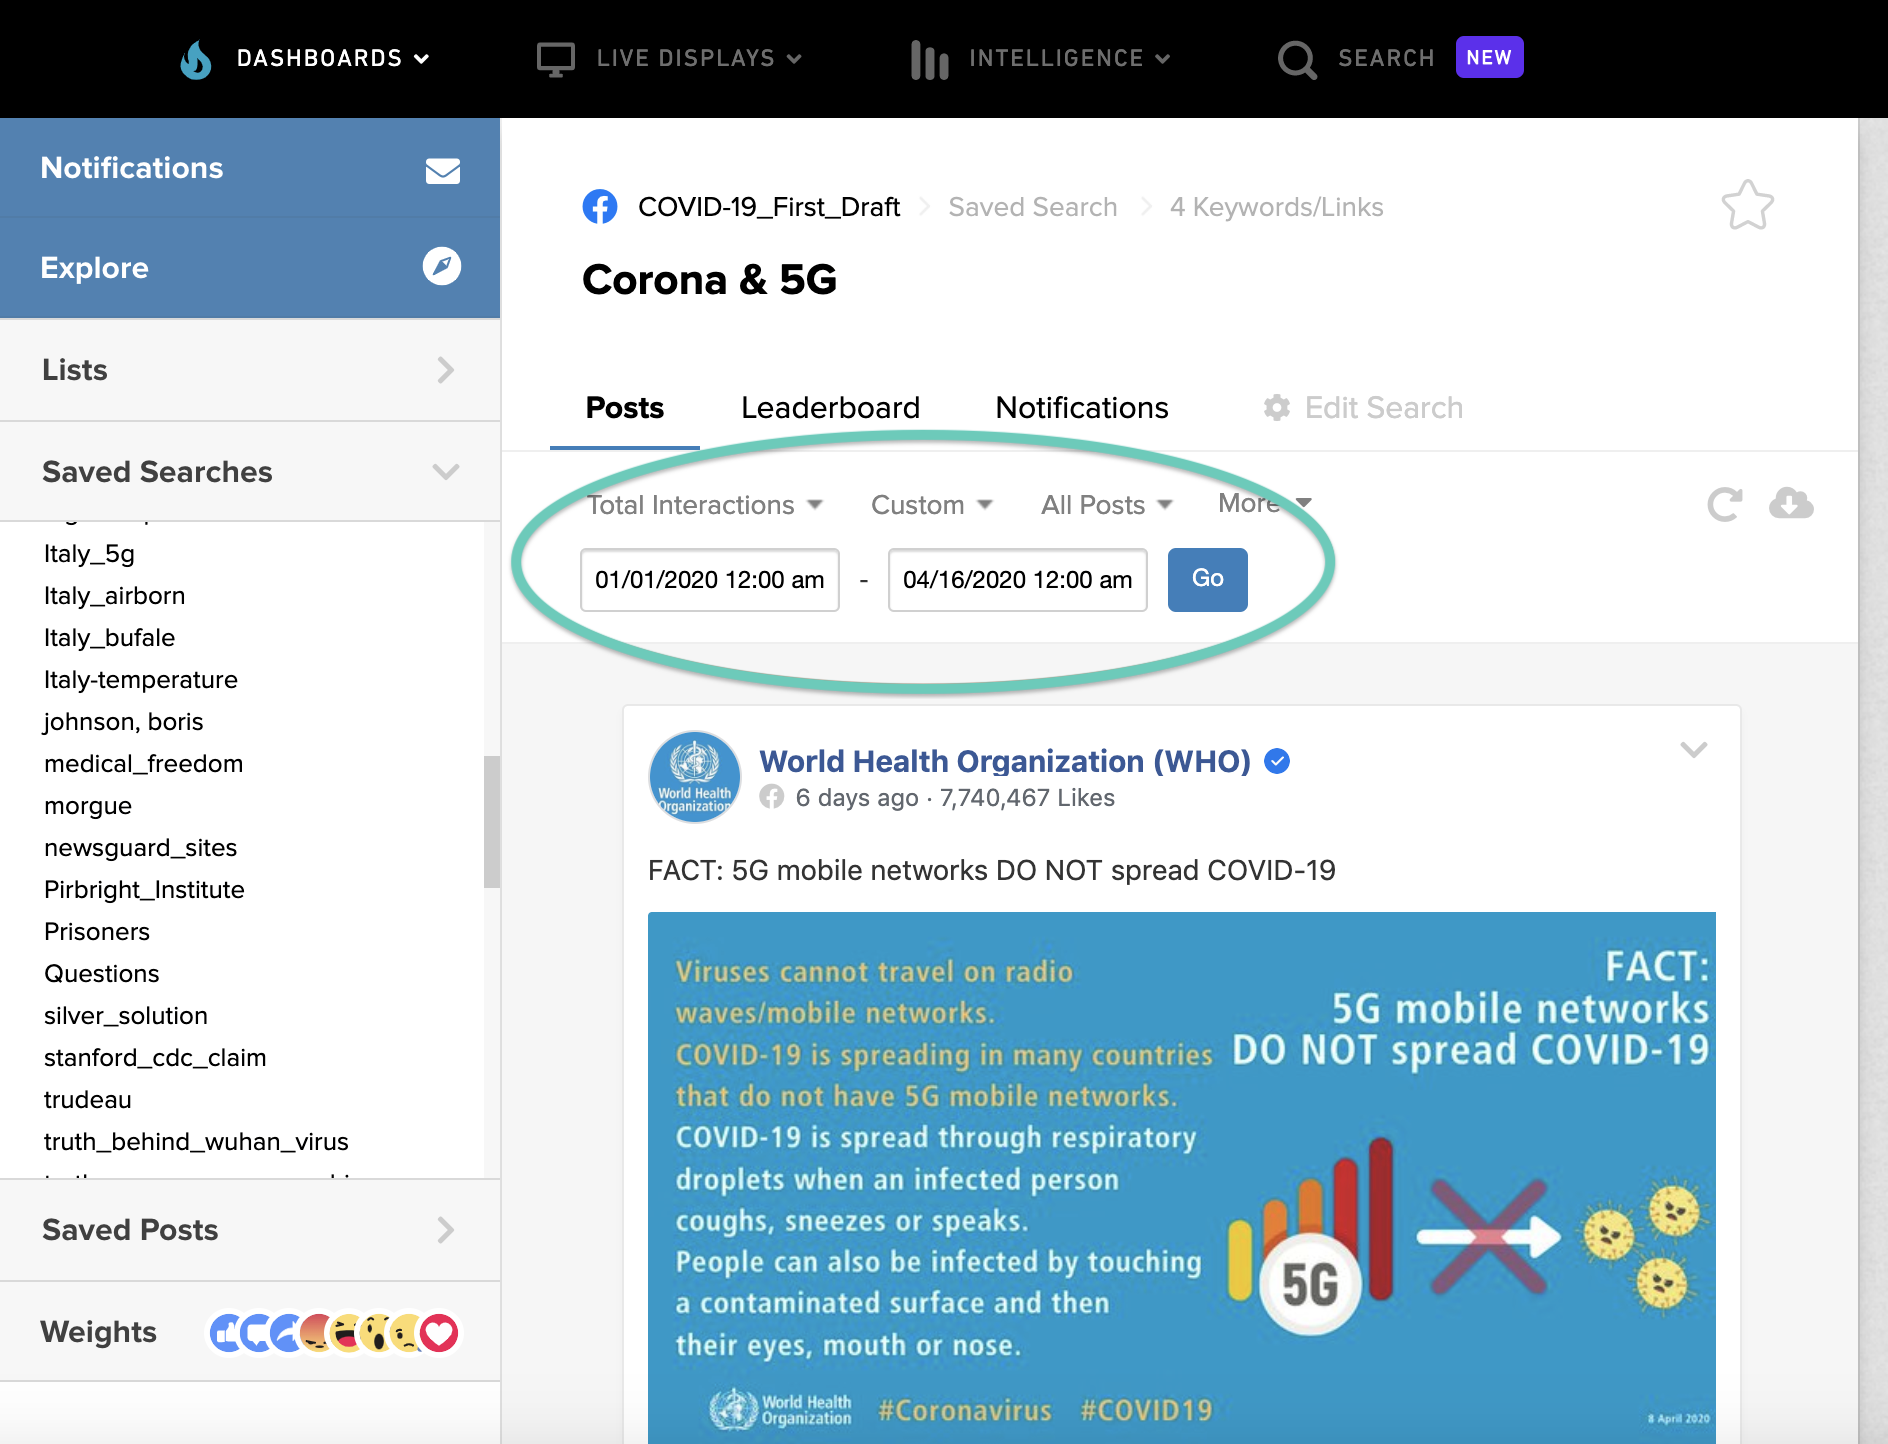
By default CrowdTangle will sort the results by ‘Overperforming’, or how well a particular post is doing compared to the average for that page or group. To download the whole dataset we have to change ‘Overperforming’ to ‘Total Interactions’, which would retrieve every public post sorted by total likes, comments, shares, and other reactions.
Click the download button (like a cloud with a down arrow, on the right) to save the data. After a few minutes, depending on the amount of data we are requesting, we will receive an email with a CSV file.
Repeat the steps to search within Facebook Groups.
Making patterns visible
Before moving forward to explore and analyze the data collected, it’s helpful to see what a public post means in terms of the available data. This annotated screenshot shows which details are accessible.
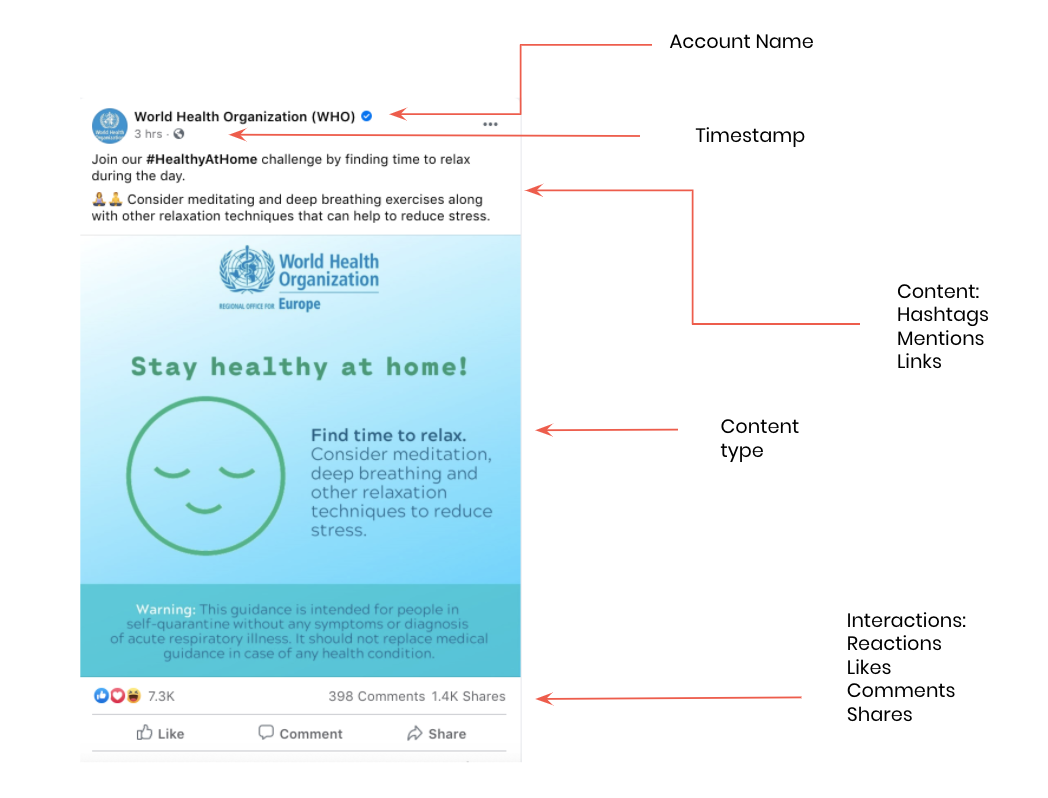
Information contained in a Facebook post.
And below is what the CSV file looks like once it is downloaded, based on our search, with columns for different fields like the name of the Page which published the post, the time and date the post was published, and more. We can also easily see the text in the post and the link to the original on the relevant platform.
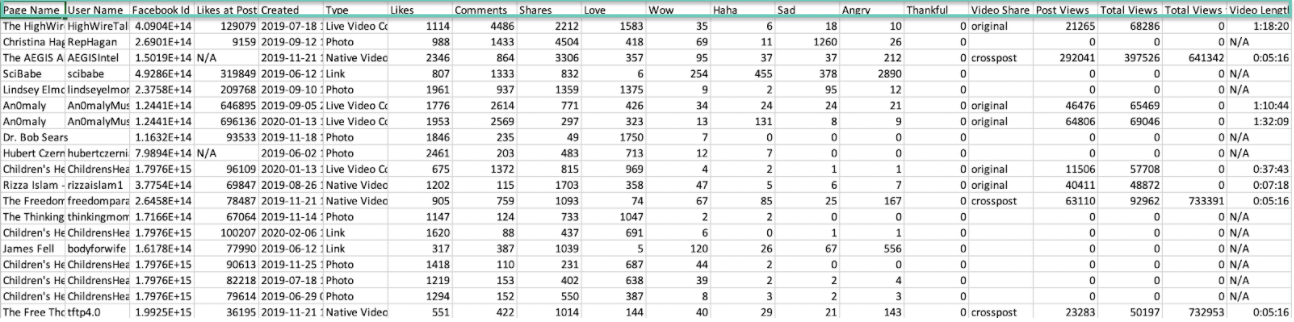
A CSV downloaded on CrowdTangle.
Data journalism is often about patterns, trends or outliers and looking at social media data is no different. Are there lots of identical posts from different accounts? Or do many posts appear on the same day? Which posts received the most interactions, and why?
It’s important to remember that we are not seeing the whole picture – we are only accessing public data – but it is enough to pull out general trends.
Import, clean and analyze the data on a Google Sheet
Once we have downloaded the CSV file, we can import it into spreadsheet software such as Microsoft Excel or Google Sheets. We’ve used the latter in this example as it is free to use, however the steps are similar in Excel.
After starting a new spreadsheet, we just need to click ‘File’ on the menu bar, then ‘Import’ to find the CSV file in our downloads. It might take a few moments depending on the size of our file.
Before starting, we need to lock the top row in our spreadsheet by clicking on ‘View’ and then ‘Freeze first row’. By doing this, we make sure the column headers remain visible as we scroll down and don’t get mixed up when we play around with the data.
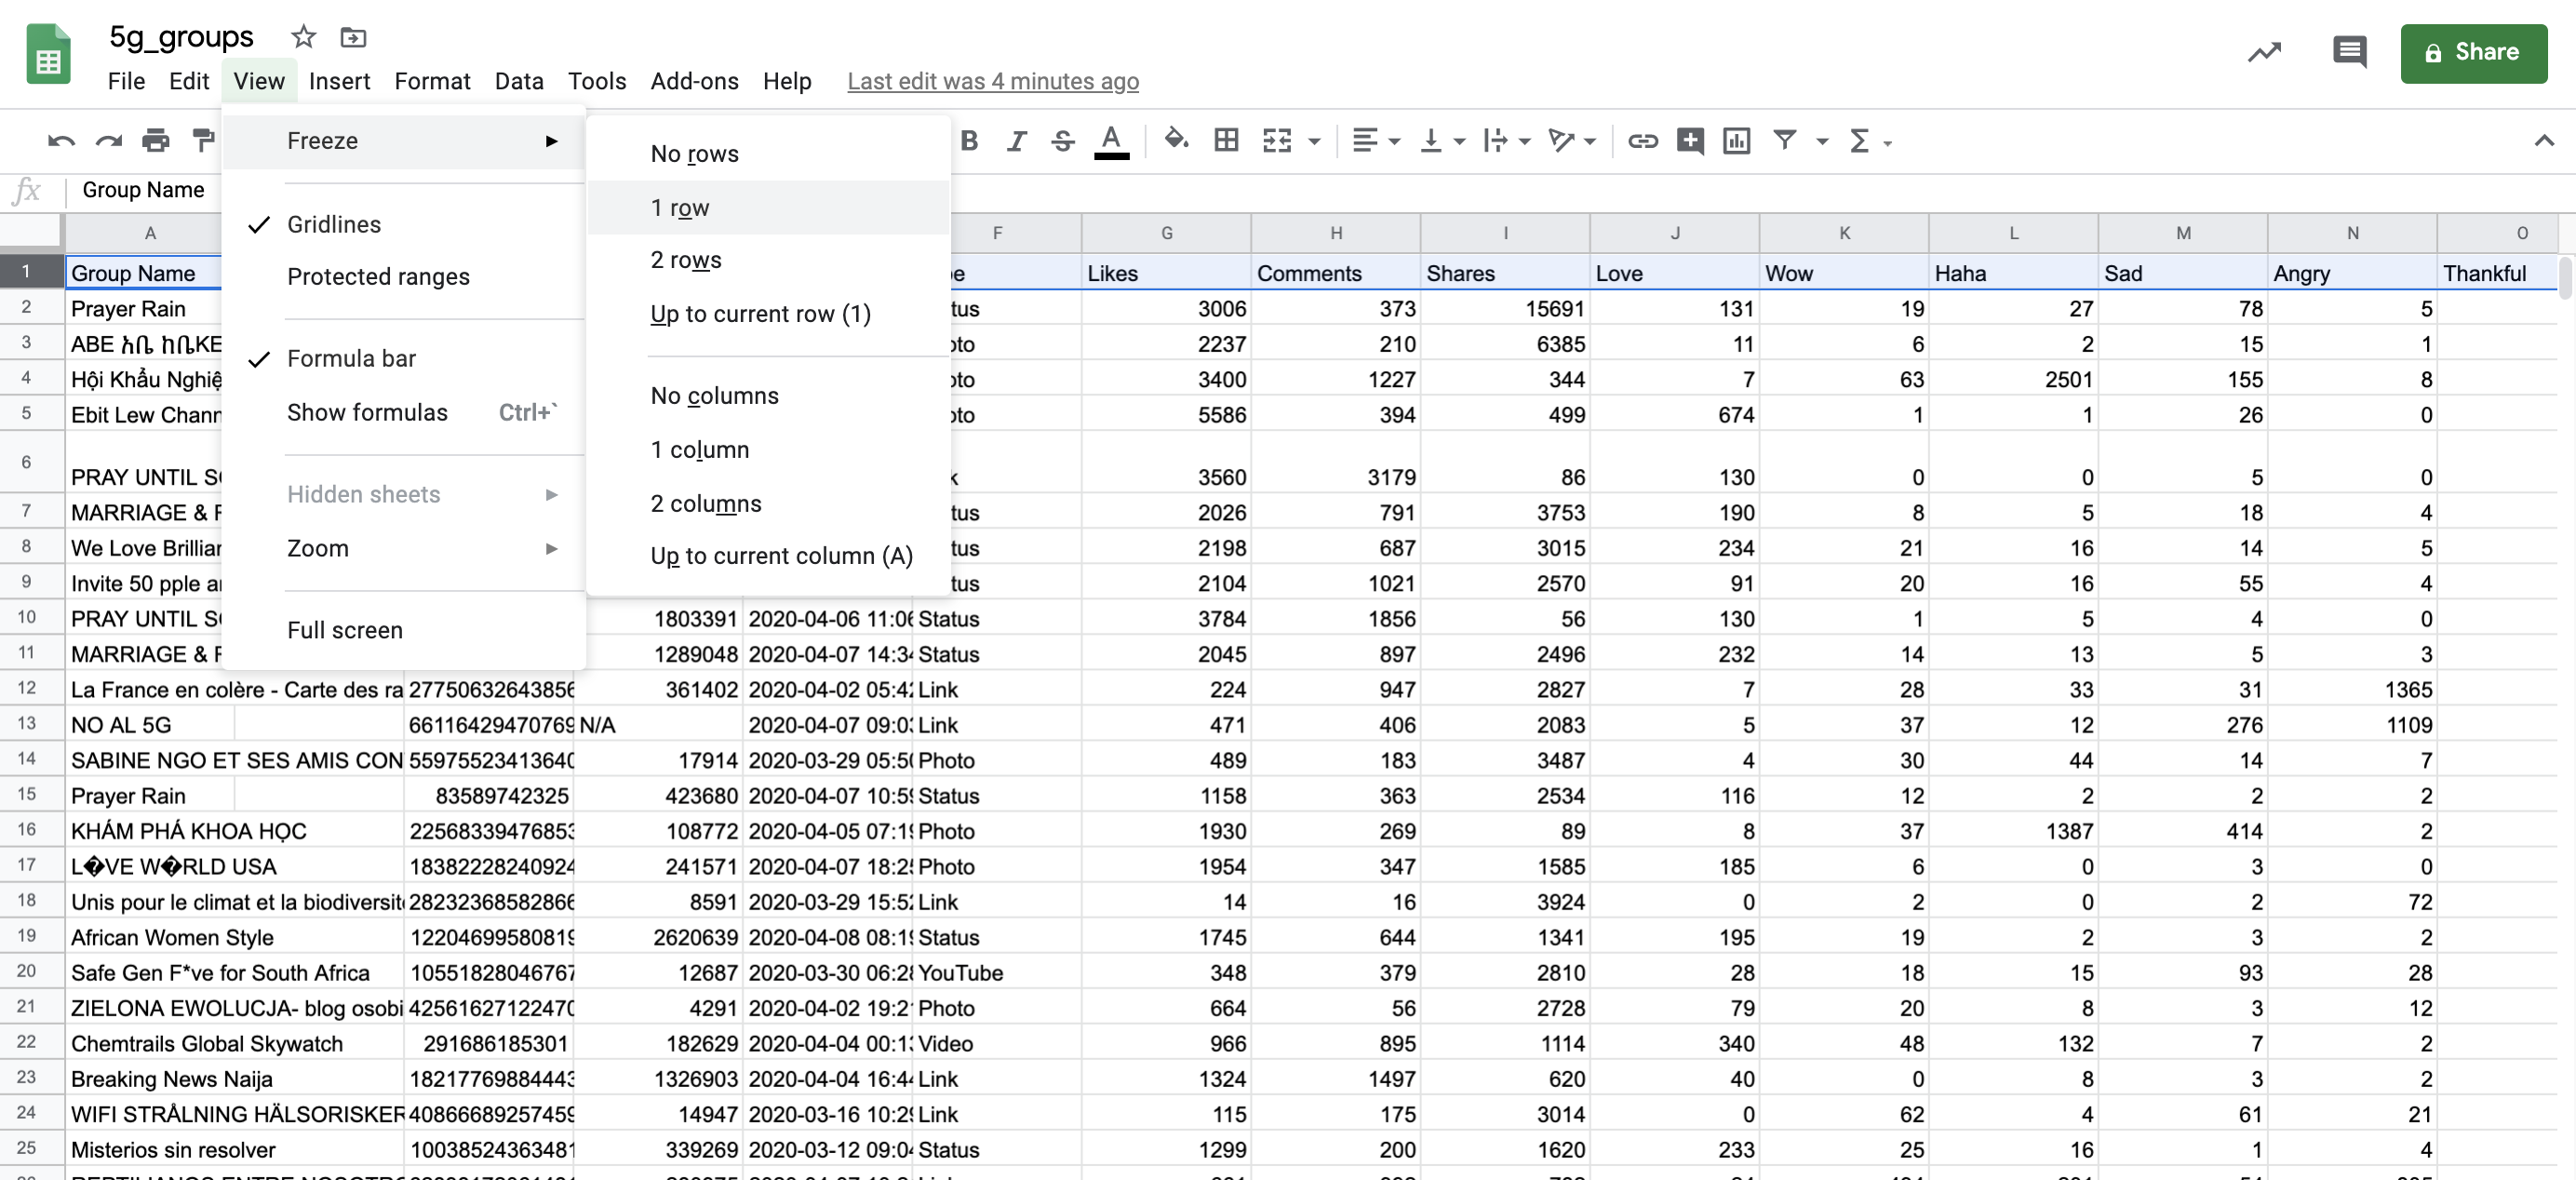
Freeze first row.
First of all, we want to make sure the data is ‘clean’ and ready to be analyzed.
Data cleaning is a fundamental process to prepare our dataset for analysis and assure accuracy and reliability. We might need to fix spelling and syntax errors, for example, or remove empty fields and duplicates to standardize the data sets.
To handle big datasets, we suggest downloading OpenRefine, an open-source tool to clean messy data. But even on Google Sheets there are a few quick actions you can take.
We sometimes end up with some non-printable characters in our ‘Group Name’ column that could interfere with our next steps. Non-printable characters are characters that fall outside of the American Standard Code for Information Interchange (ASCII) range, that we might wish to remove.
We can easily remove them by adding a new column and writing the function =CLEAN(A2) on the second row of the new column. With the CLEAN function, we remove any non-printable computer characters presented in our worksheet.
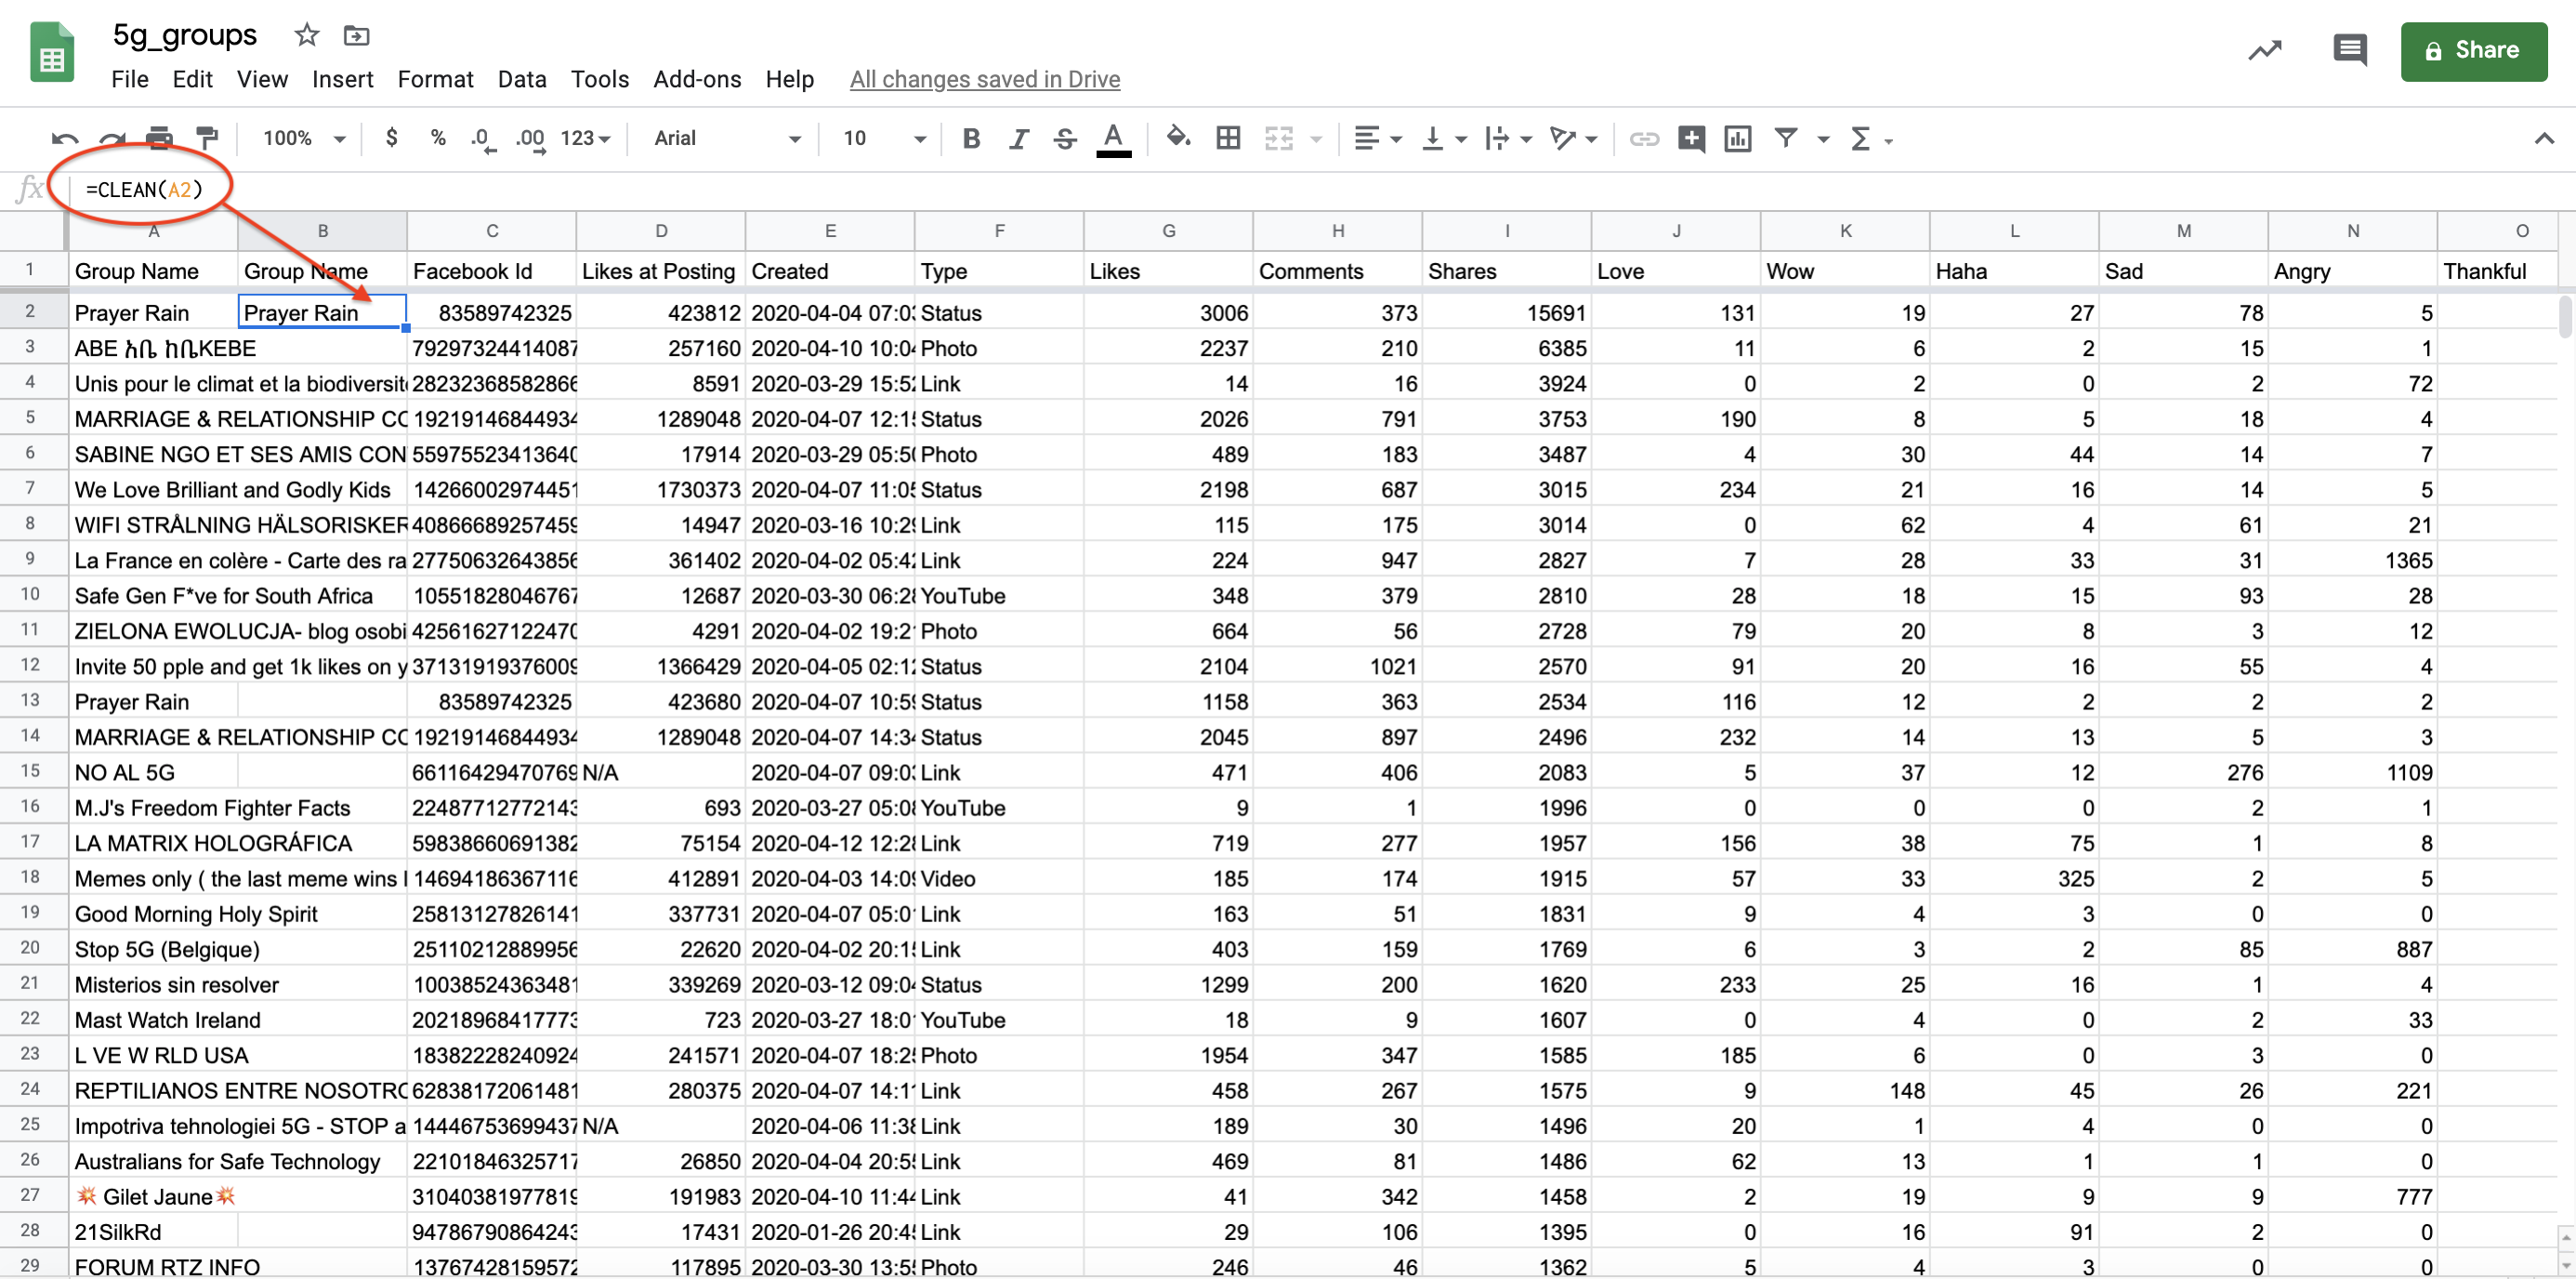
Clean unknown characters.
To do this for the whole column, select the top cell and then hit ctrl+shift+down.
We can also easily remove some specific characters by selecting a column, press command+F on a Mac or ctrl+F on a PC, and then the three dots for ‘more options’. Here we type any character we want to remove and replace with a blank-space, and we click ‘Replace all’.
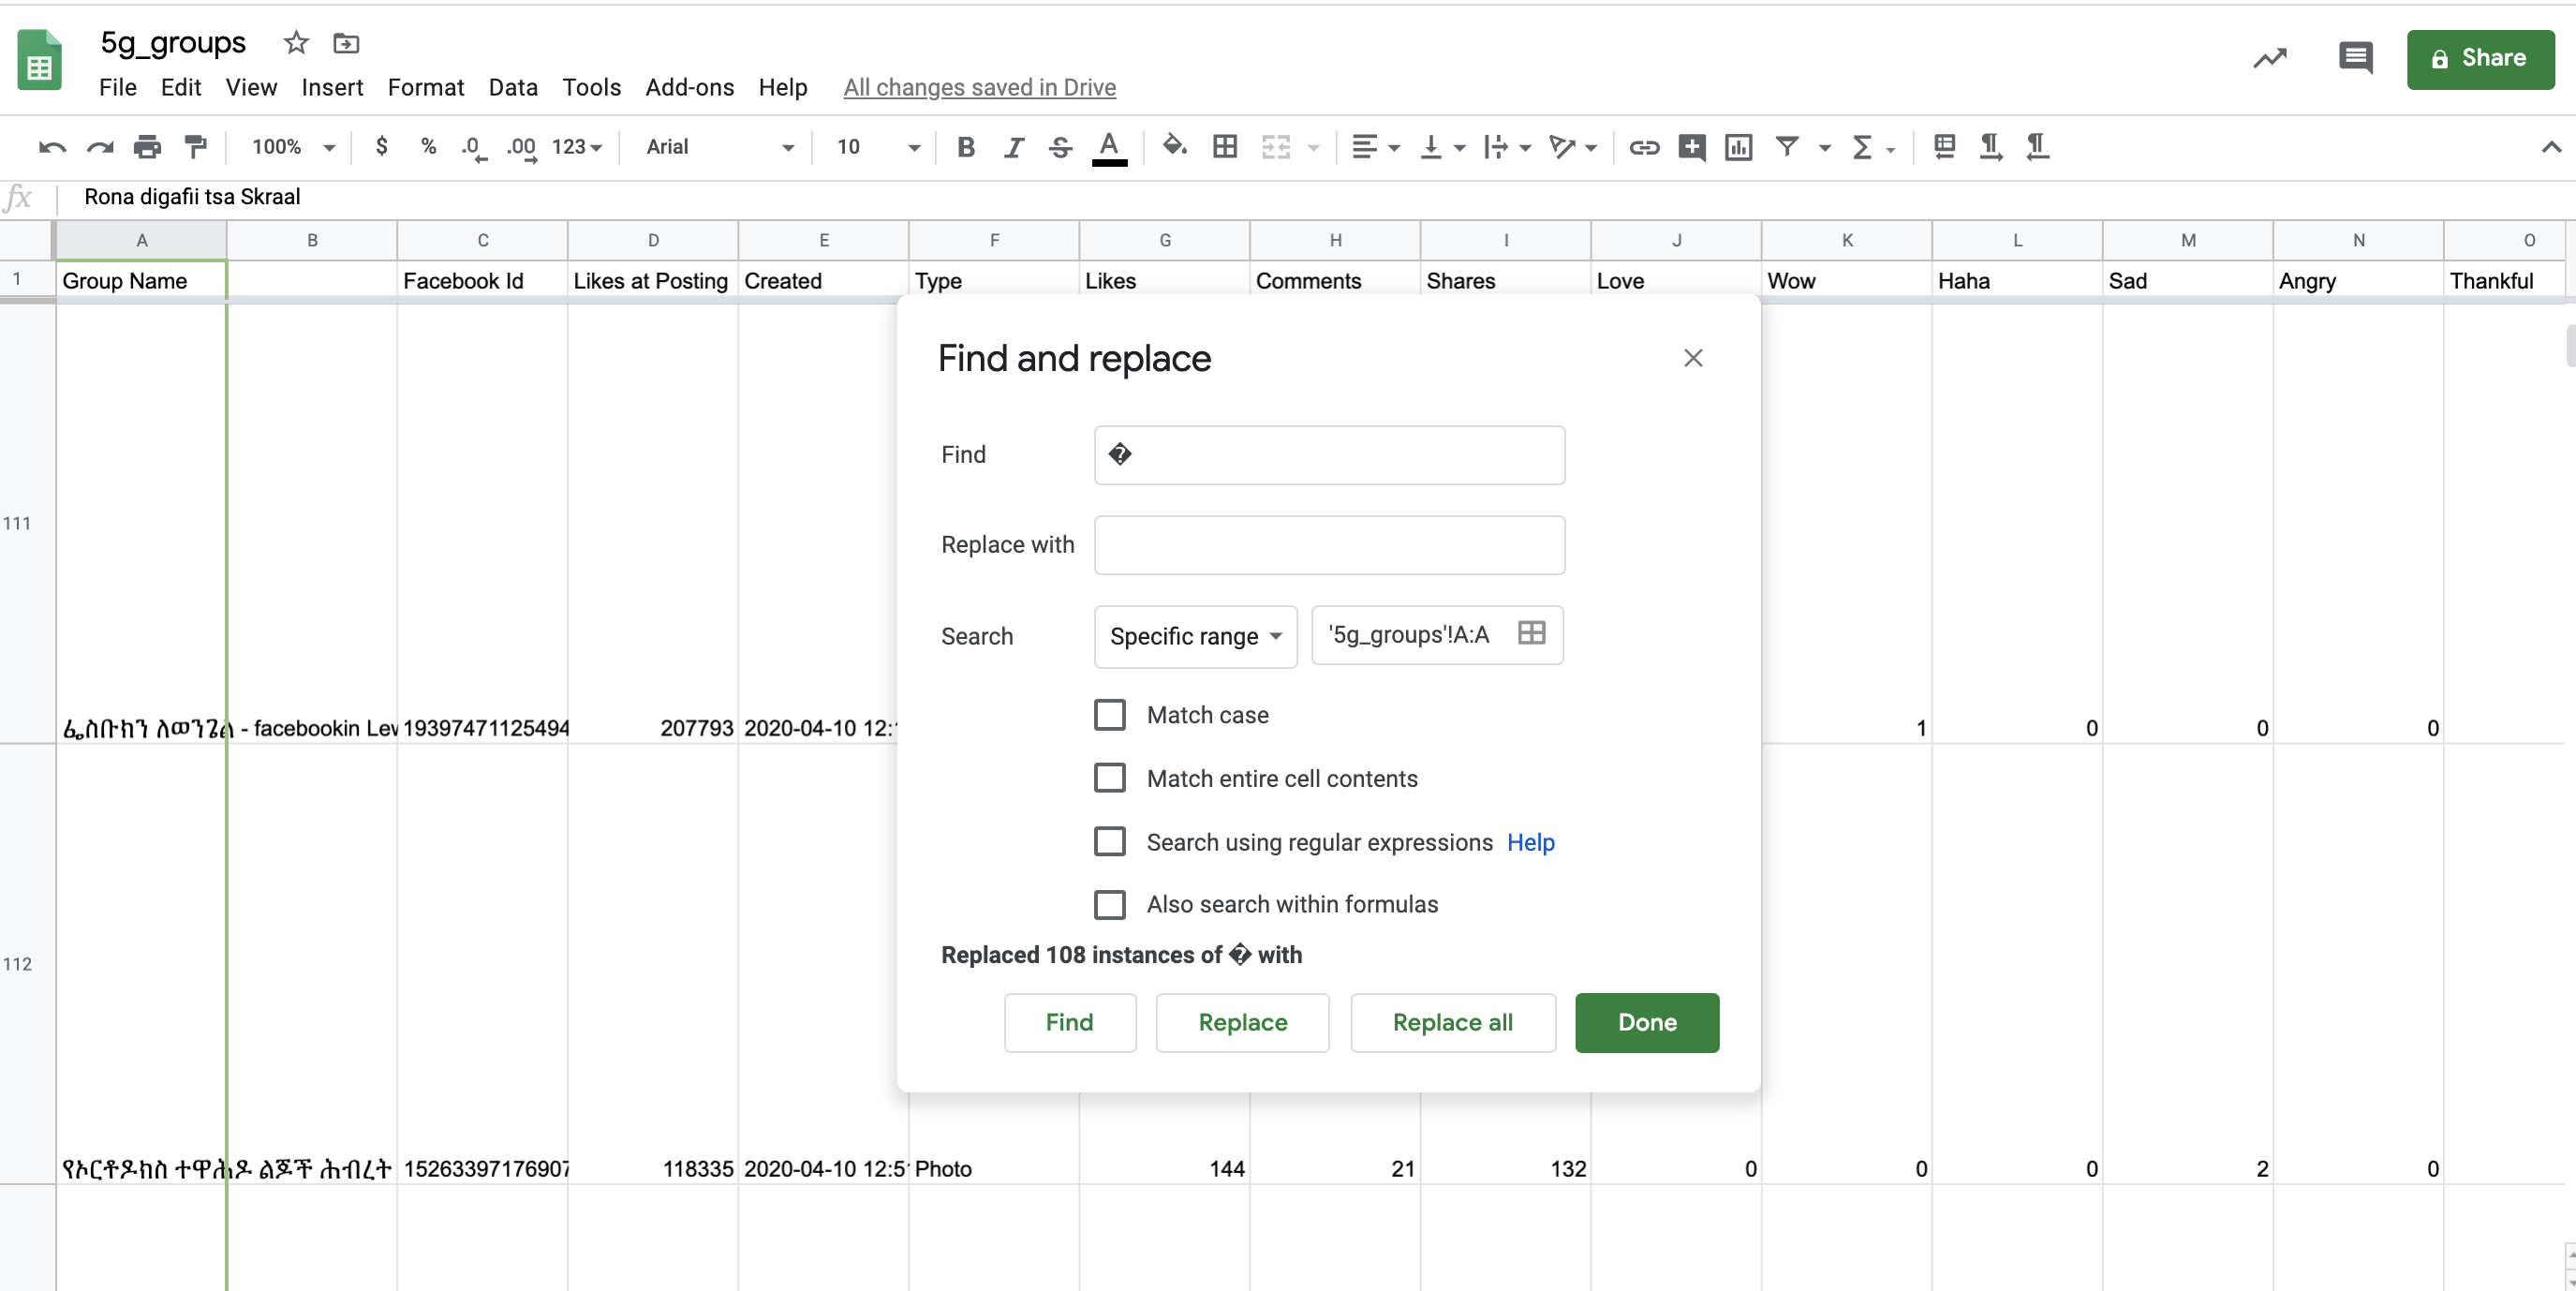
The Find and Replace feature.
We also want to make sure the dates in the ‘Created’ column are formatted correctly.
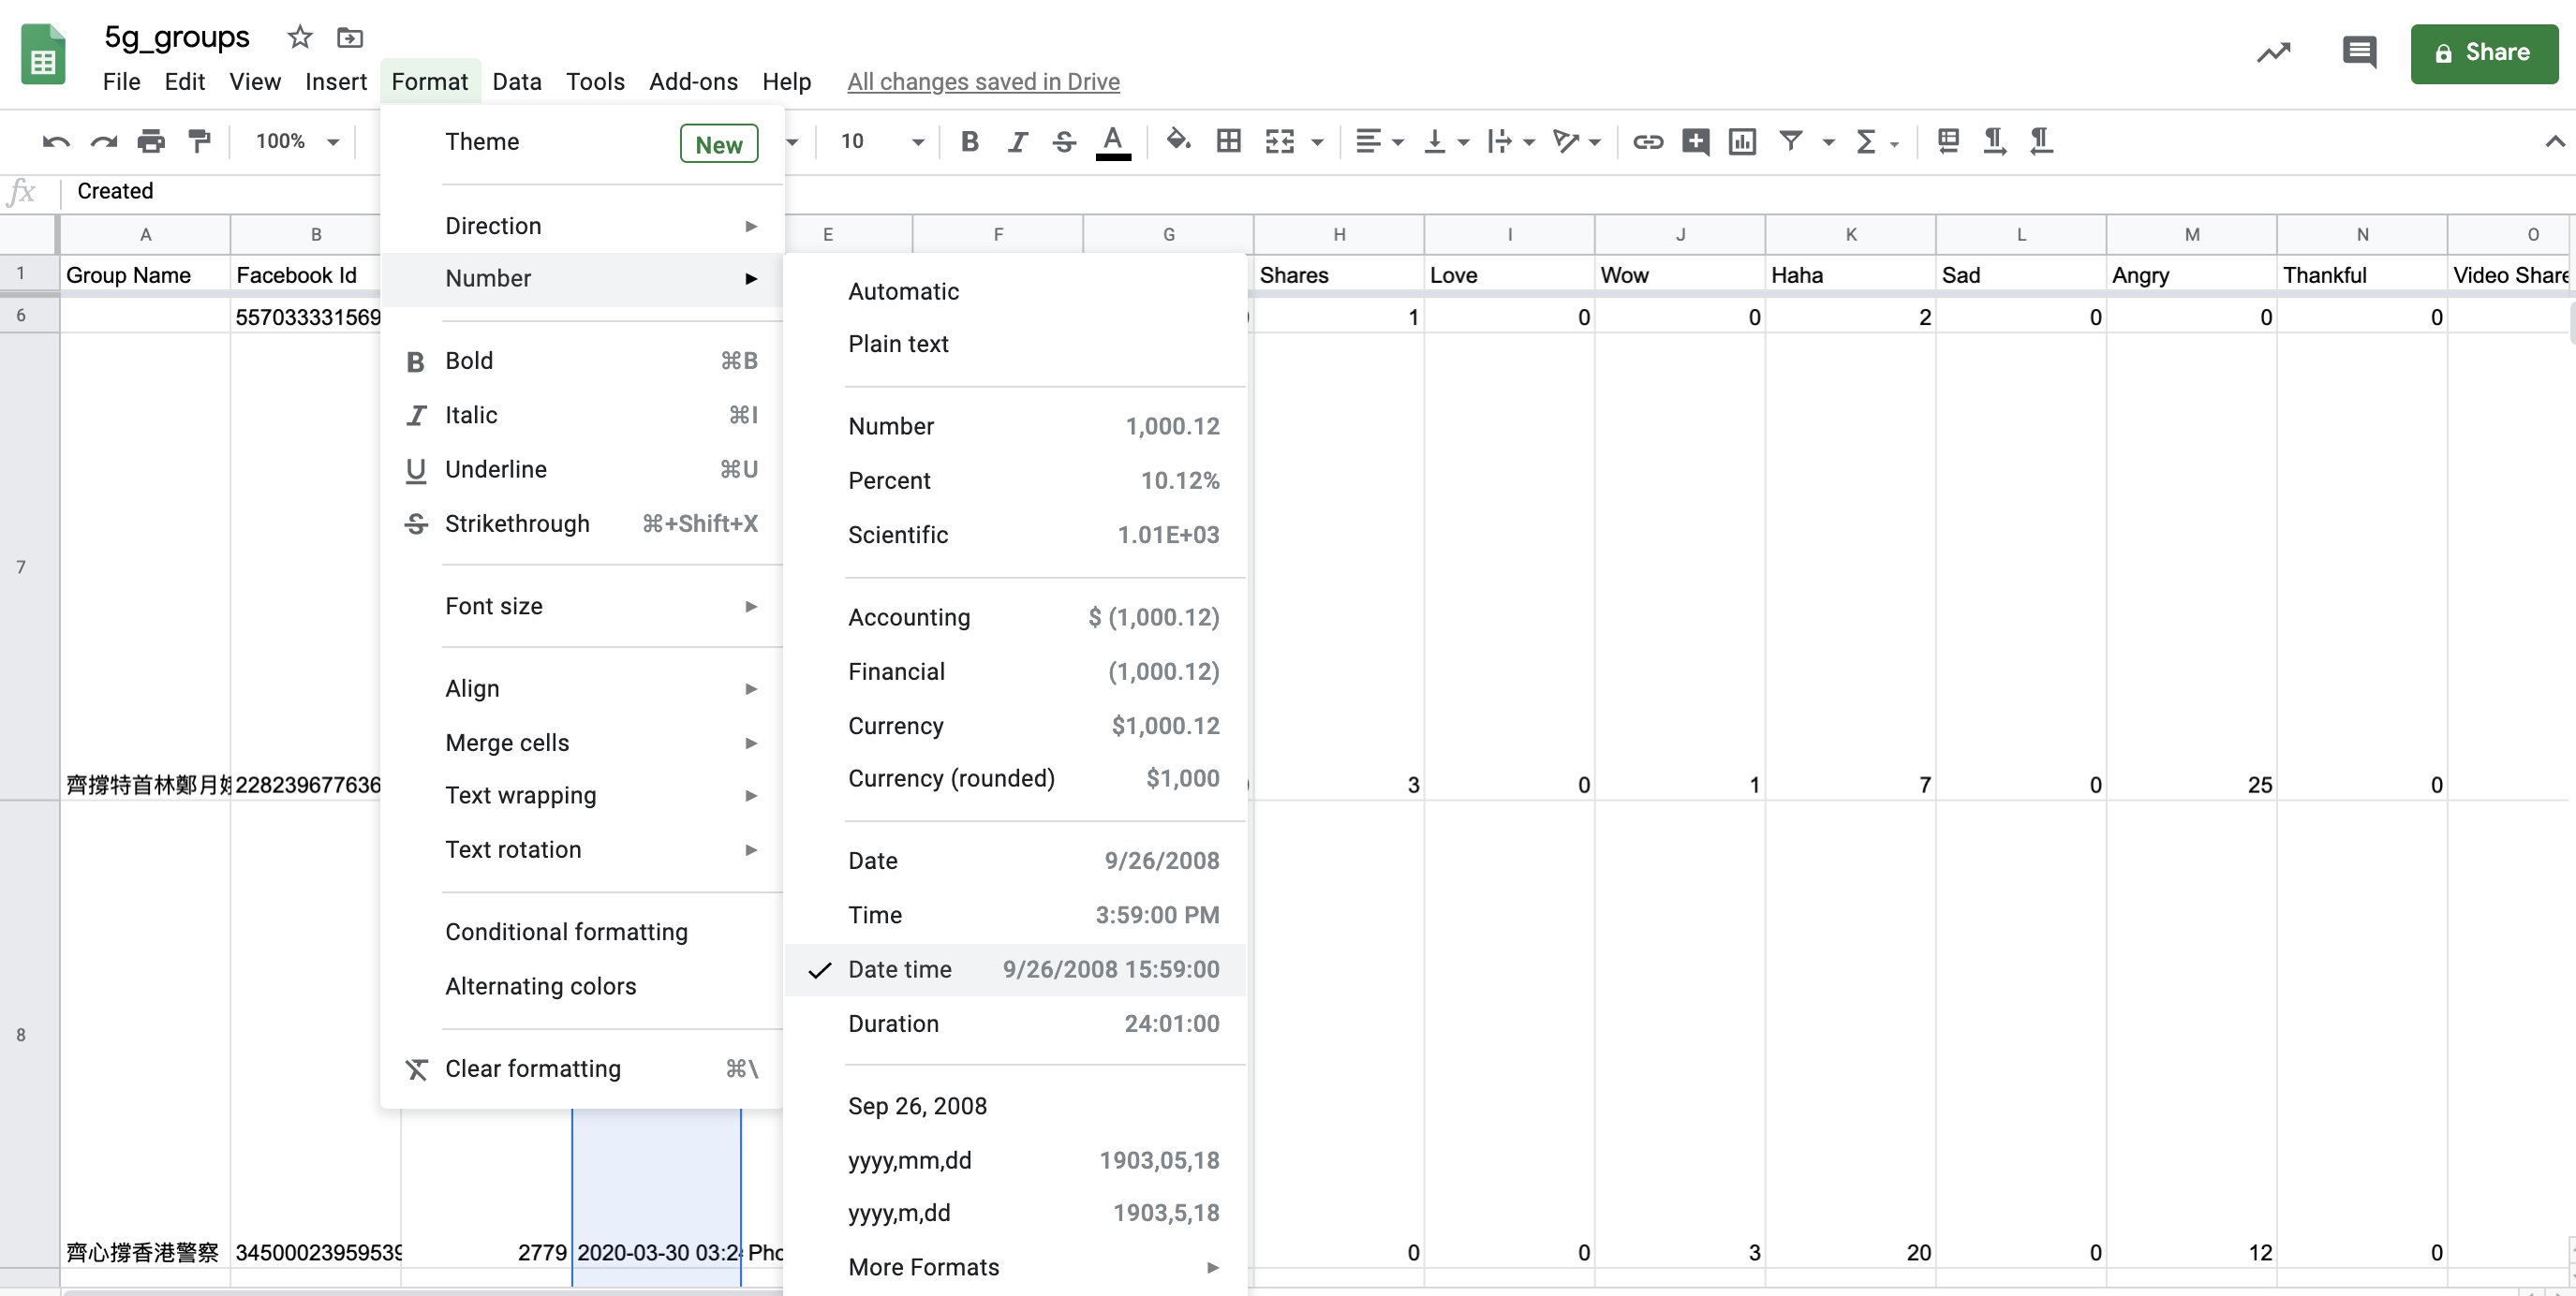
Change date format.
We select the ‘Created’ column, then go under ‘Format’, ‘Number’ and click on the date format we need for our analysis. We can also click on ‘More Formats’ and customize our own format. This is particularly important if we want to visualize the data which often requires specific date formats.
Once we’ve cleaned up the data, we can move to look at some general patterns in our dataset.
Type the function =MEDIAN(X2:X10001), where X is the column letter, at the end of each column to calculate the average. For example, in our 5G dataset the median of the ‘Total Interaction’ column is 94, which means 5G posts reached an average of 94 interactions – a figure which we would need to investigate more to understand if it is significant.
We can also look more closely at the different reactions from users to the post, such as ‘Haha’ and ‘Angry’, to see what was the most popular in terms of average reactions per post.
Let’s explore some of the posts which attracted the highest number of shares by sorting the data by ‘Shares’ column. We look at shares because we consider it to be the most significant interaction in terms of tipping point.
Click the small arrow at the top of the column then select ‘Sort sheet Z → A’ and the whole worksheet will change order: from posts with the highest number of shares on the top, down to the lowest.
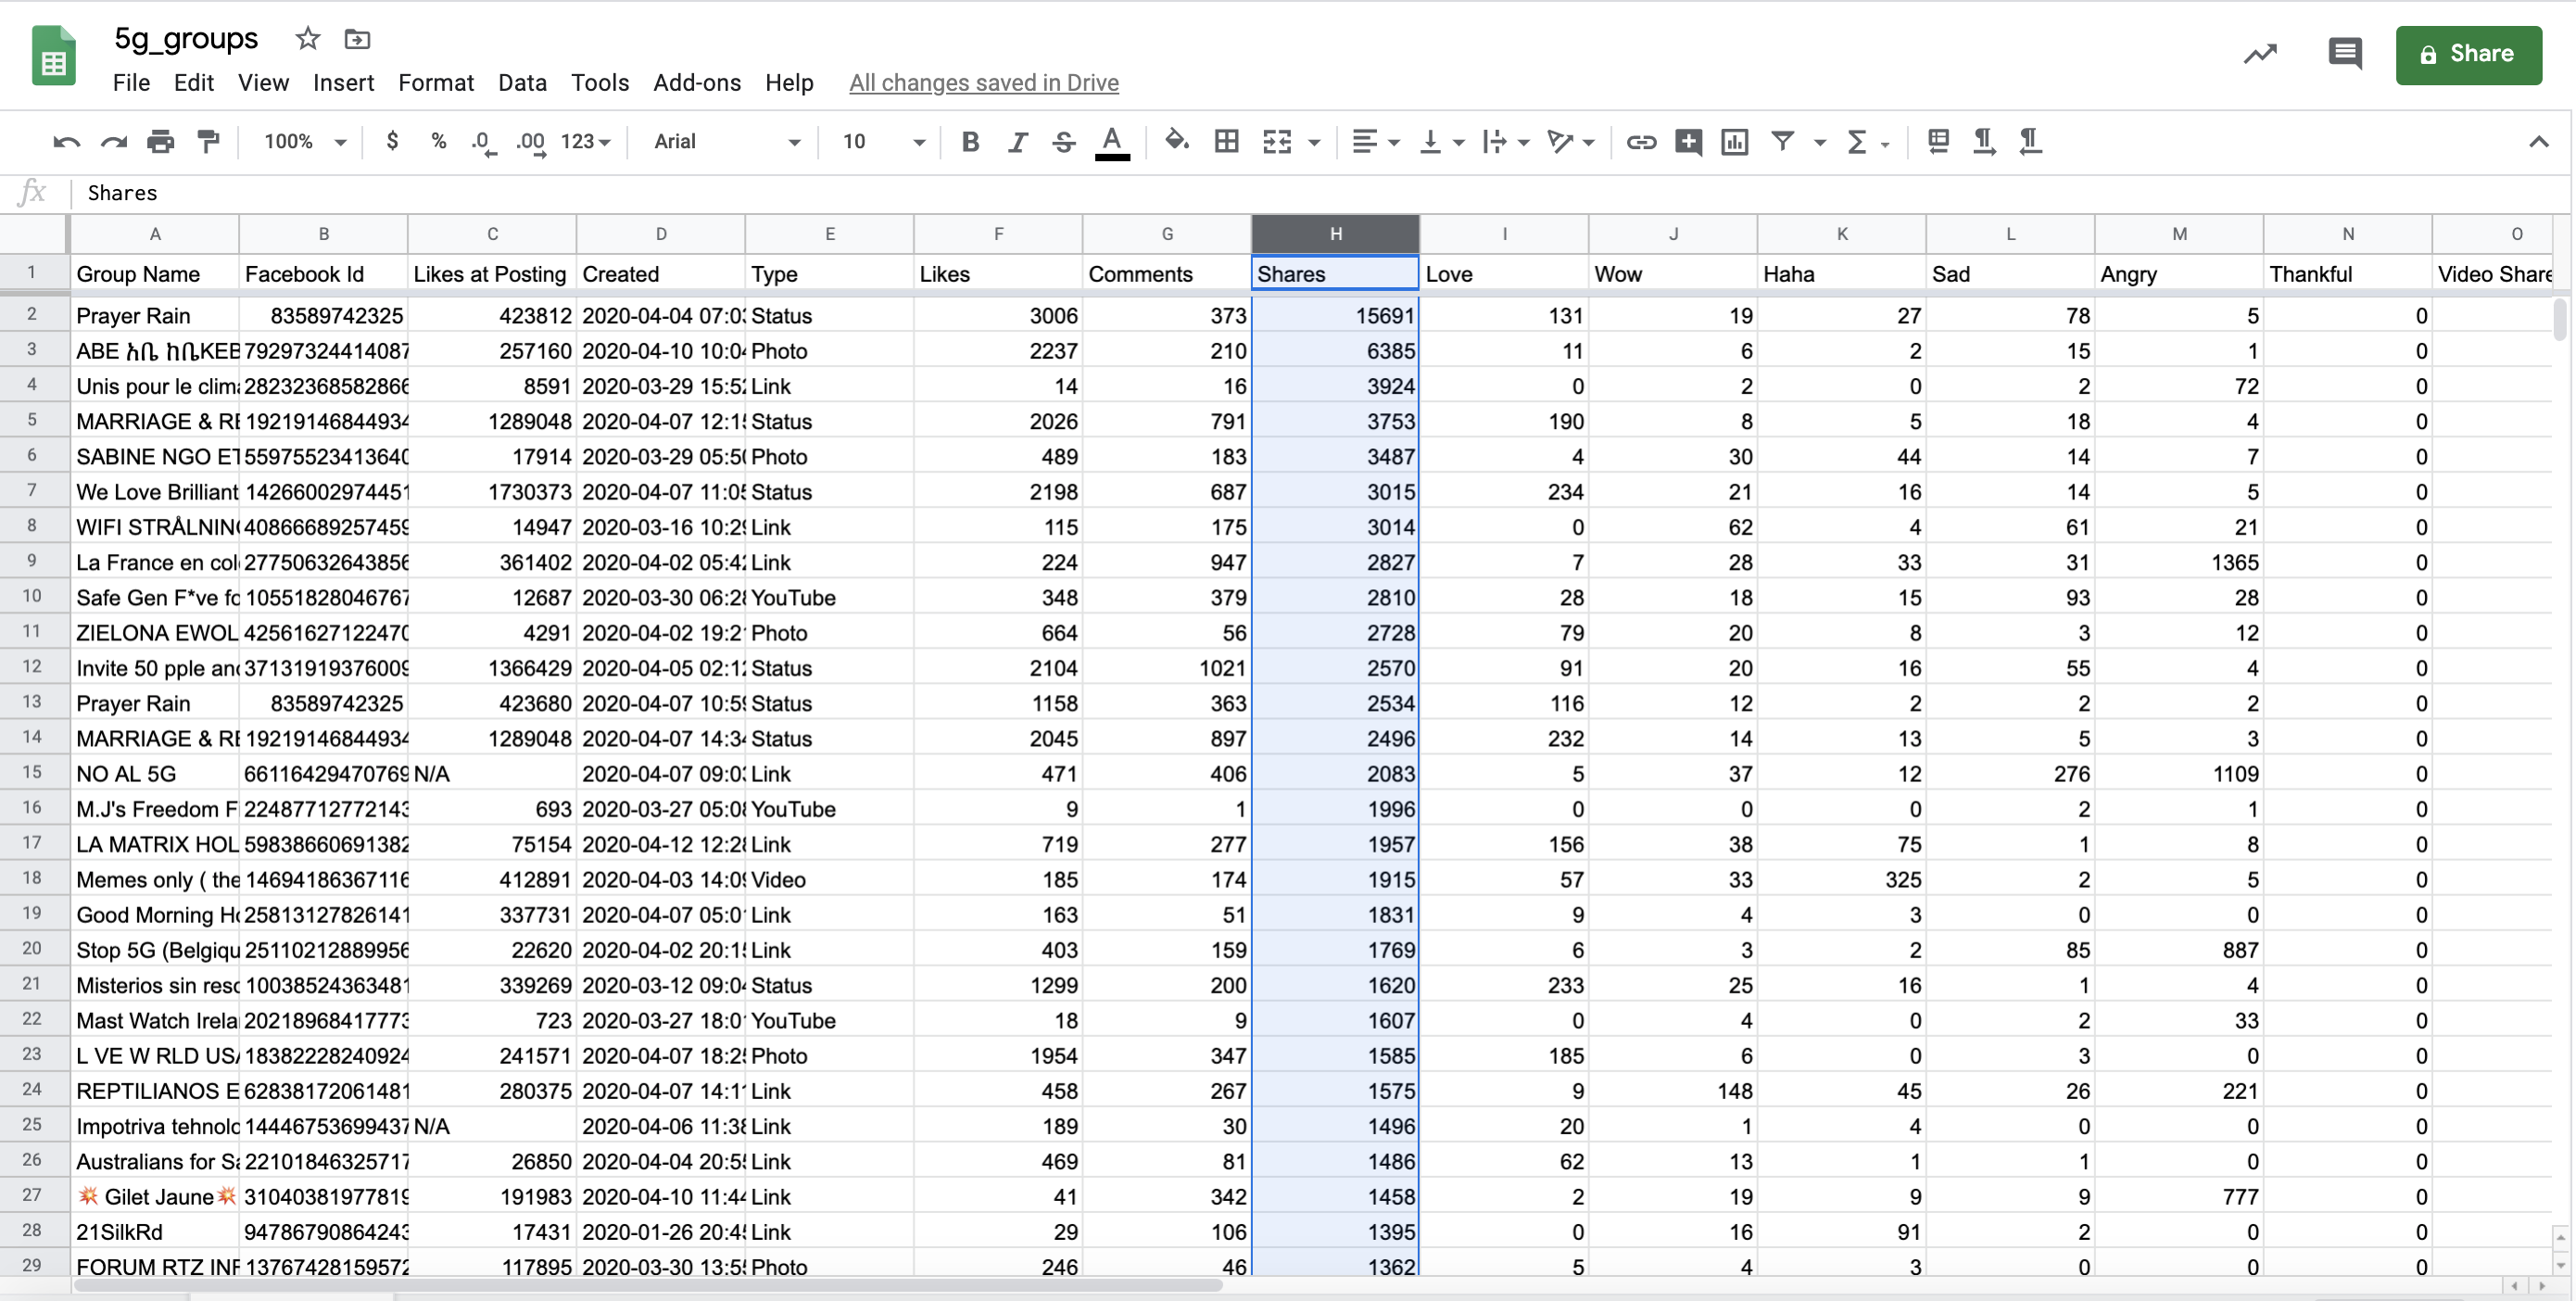
Sort the dataset by shares
By clicking through the URLs here we can analyze the content of the top ten most shared posts in the dataset and their source.
We can also focus on the messages of the top posts and analyze their content. For example, we can have a quick overview of which languages people are using the most to spread the rumor: we add a column on the right of the ‘Message’ column and we type the function: =DETECTLANGUAGE(U2), where U2 is the ‘Message’ column. If many of the top pages in our dataset use different languages, it might mean a rumour or misleading narrative has spread outside of a specific region and become global.
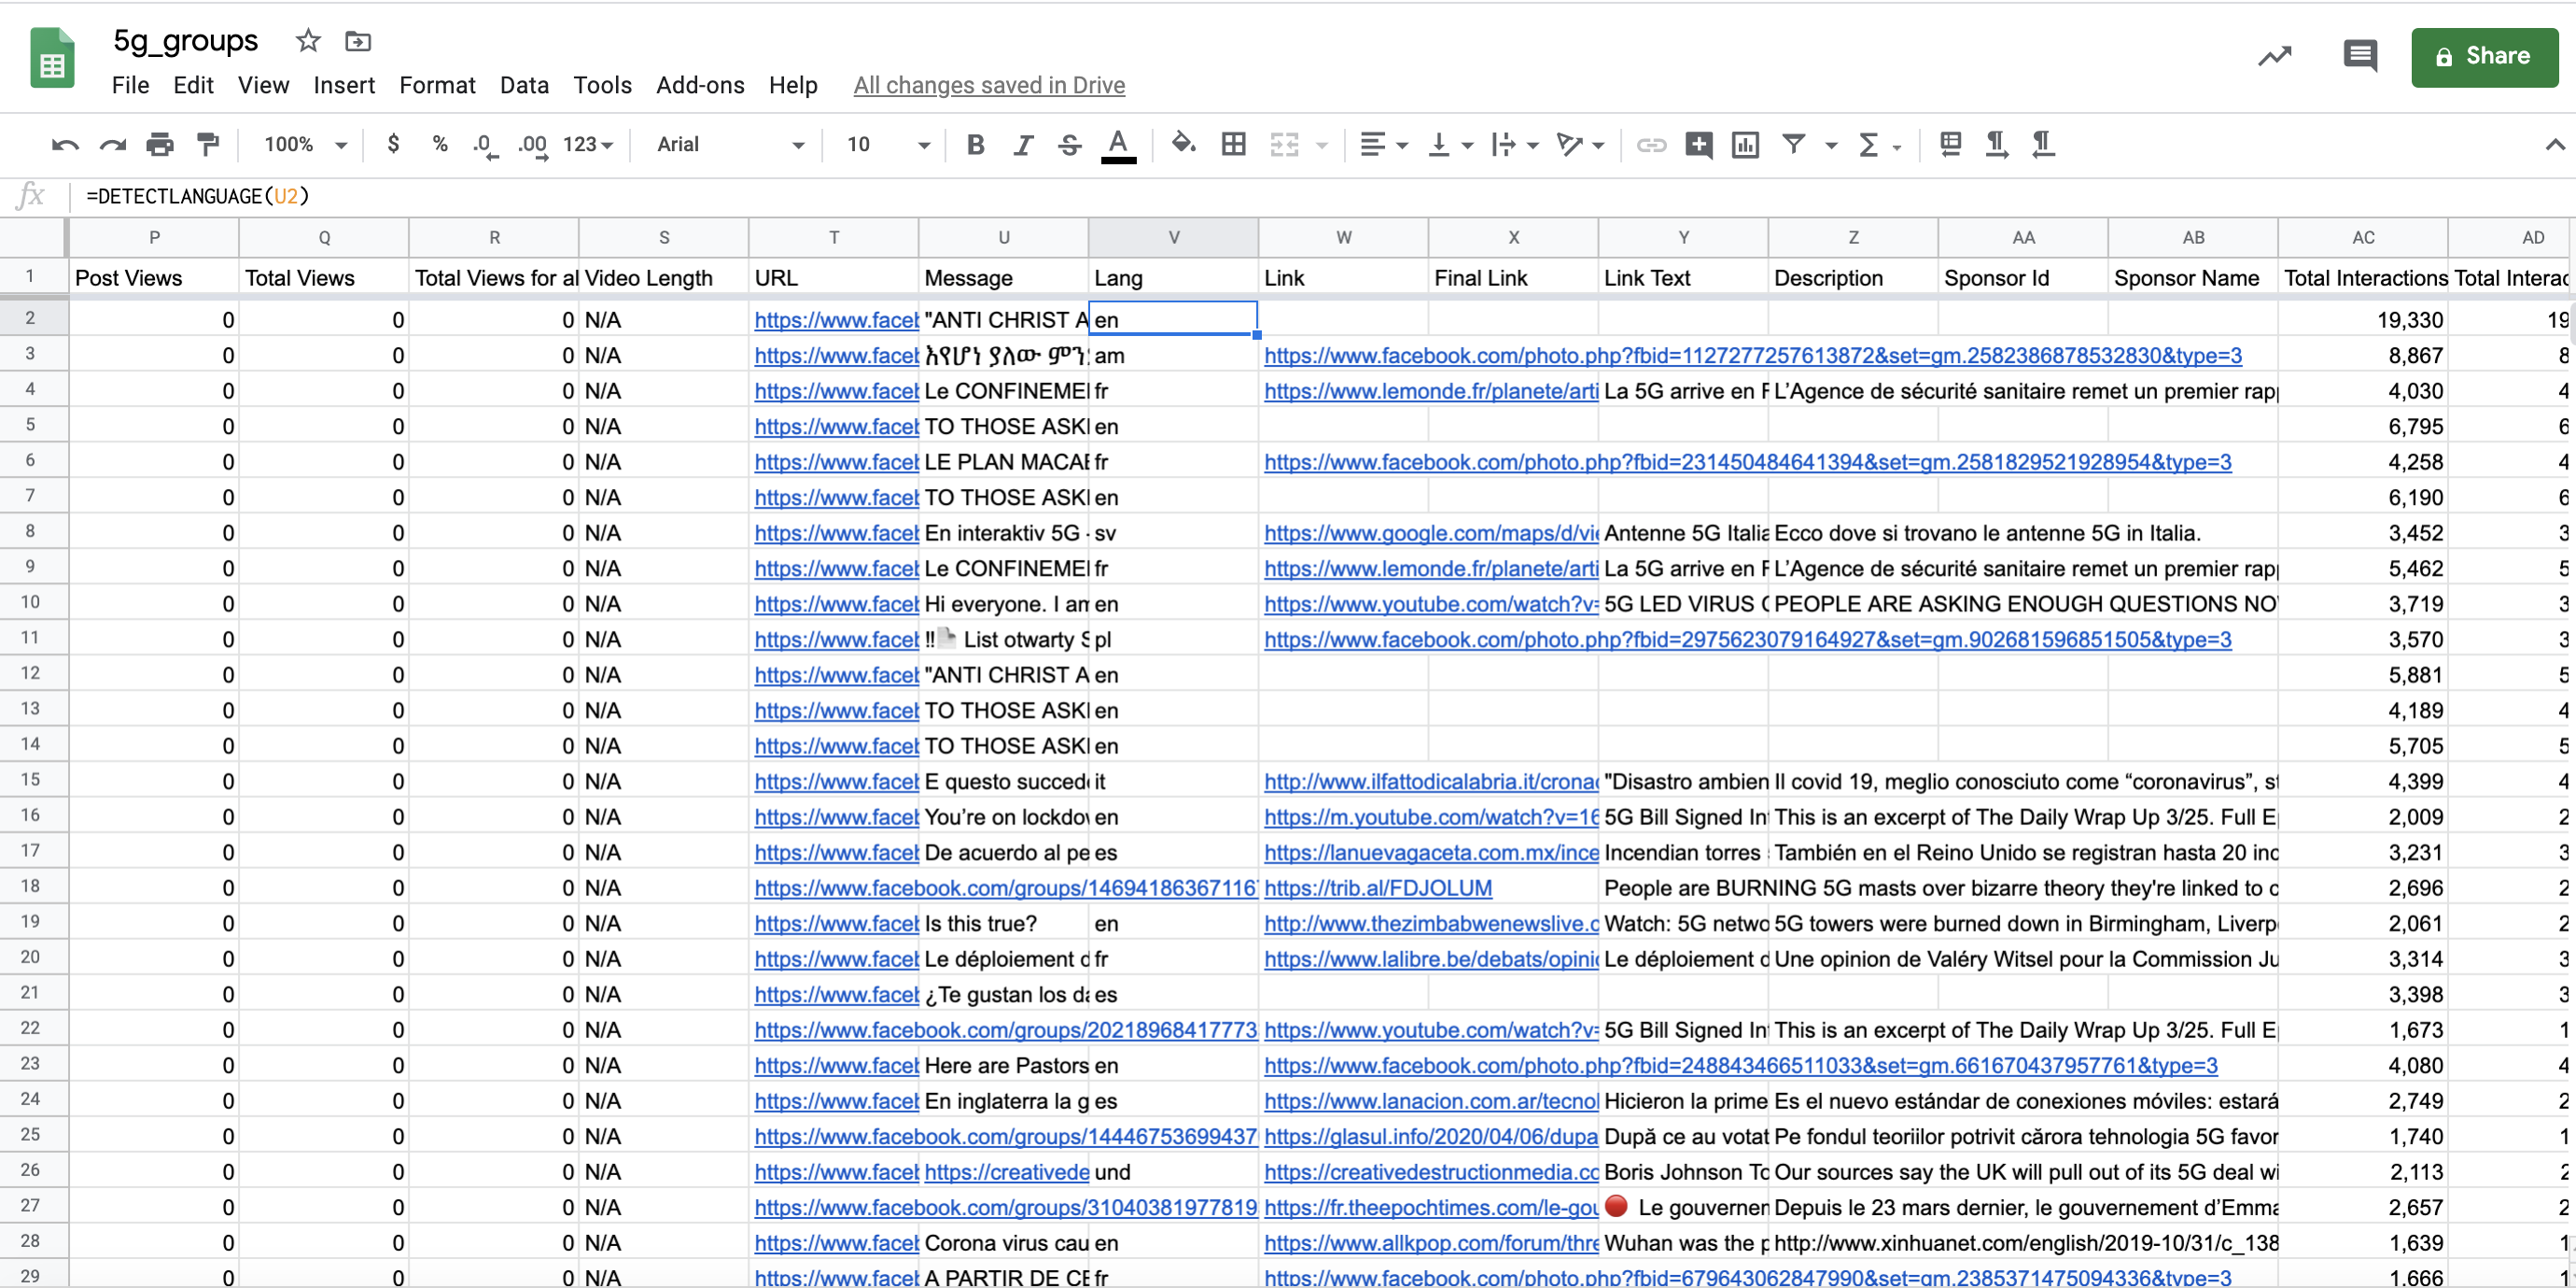
Detect language.
A similar analysis, but from a different perspective, involves analyzing the most common Groups in our dataset. To address this question we need to create a pivot table. There are numerous valuable things we can do with the simple use of a pivot table, segmenting the sheet and making a huge amount of data more manageable.
First, select all of our data by clicking on the little rectangle on the top left side of the sheet. Then go to ‘Data’ on the top menu and select ‘Pivot Table’.
On the new page, we’ll have a few options to determine the rows, columns, values, and filters for our pivot table. Select ‘Group Names’ both under ‘Rows’ and ‘Value’, because we want to see how many times each Group name recurs in the dataset.
Then we summarize by ‘COUNTA’ under ‘Value’. This will quickly summarize the entire dataset by unique Group Names and tell us how many times that name appears in the dataset.
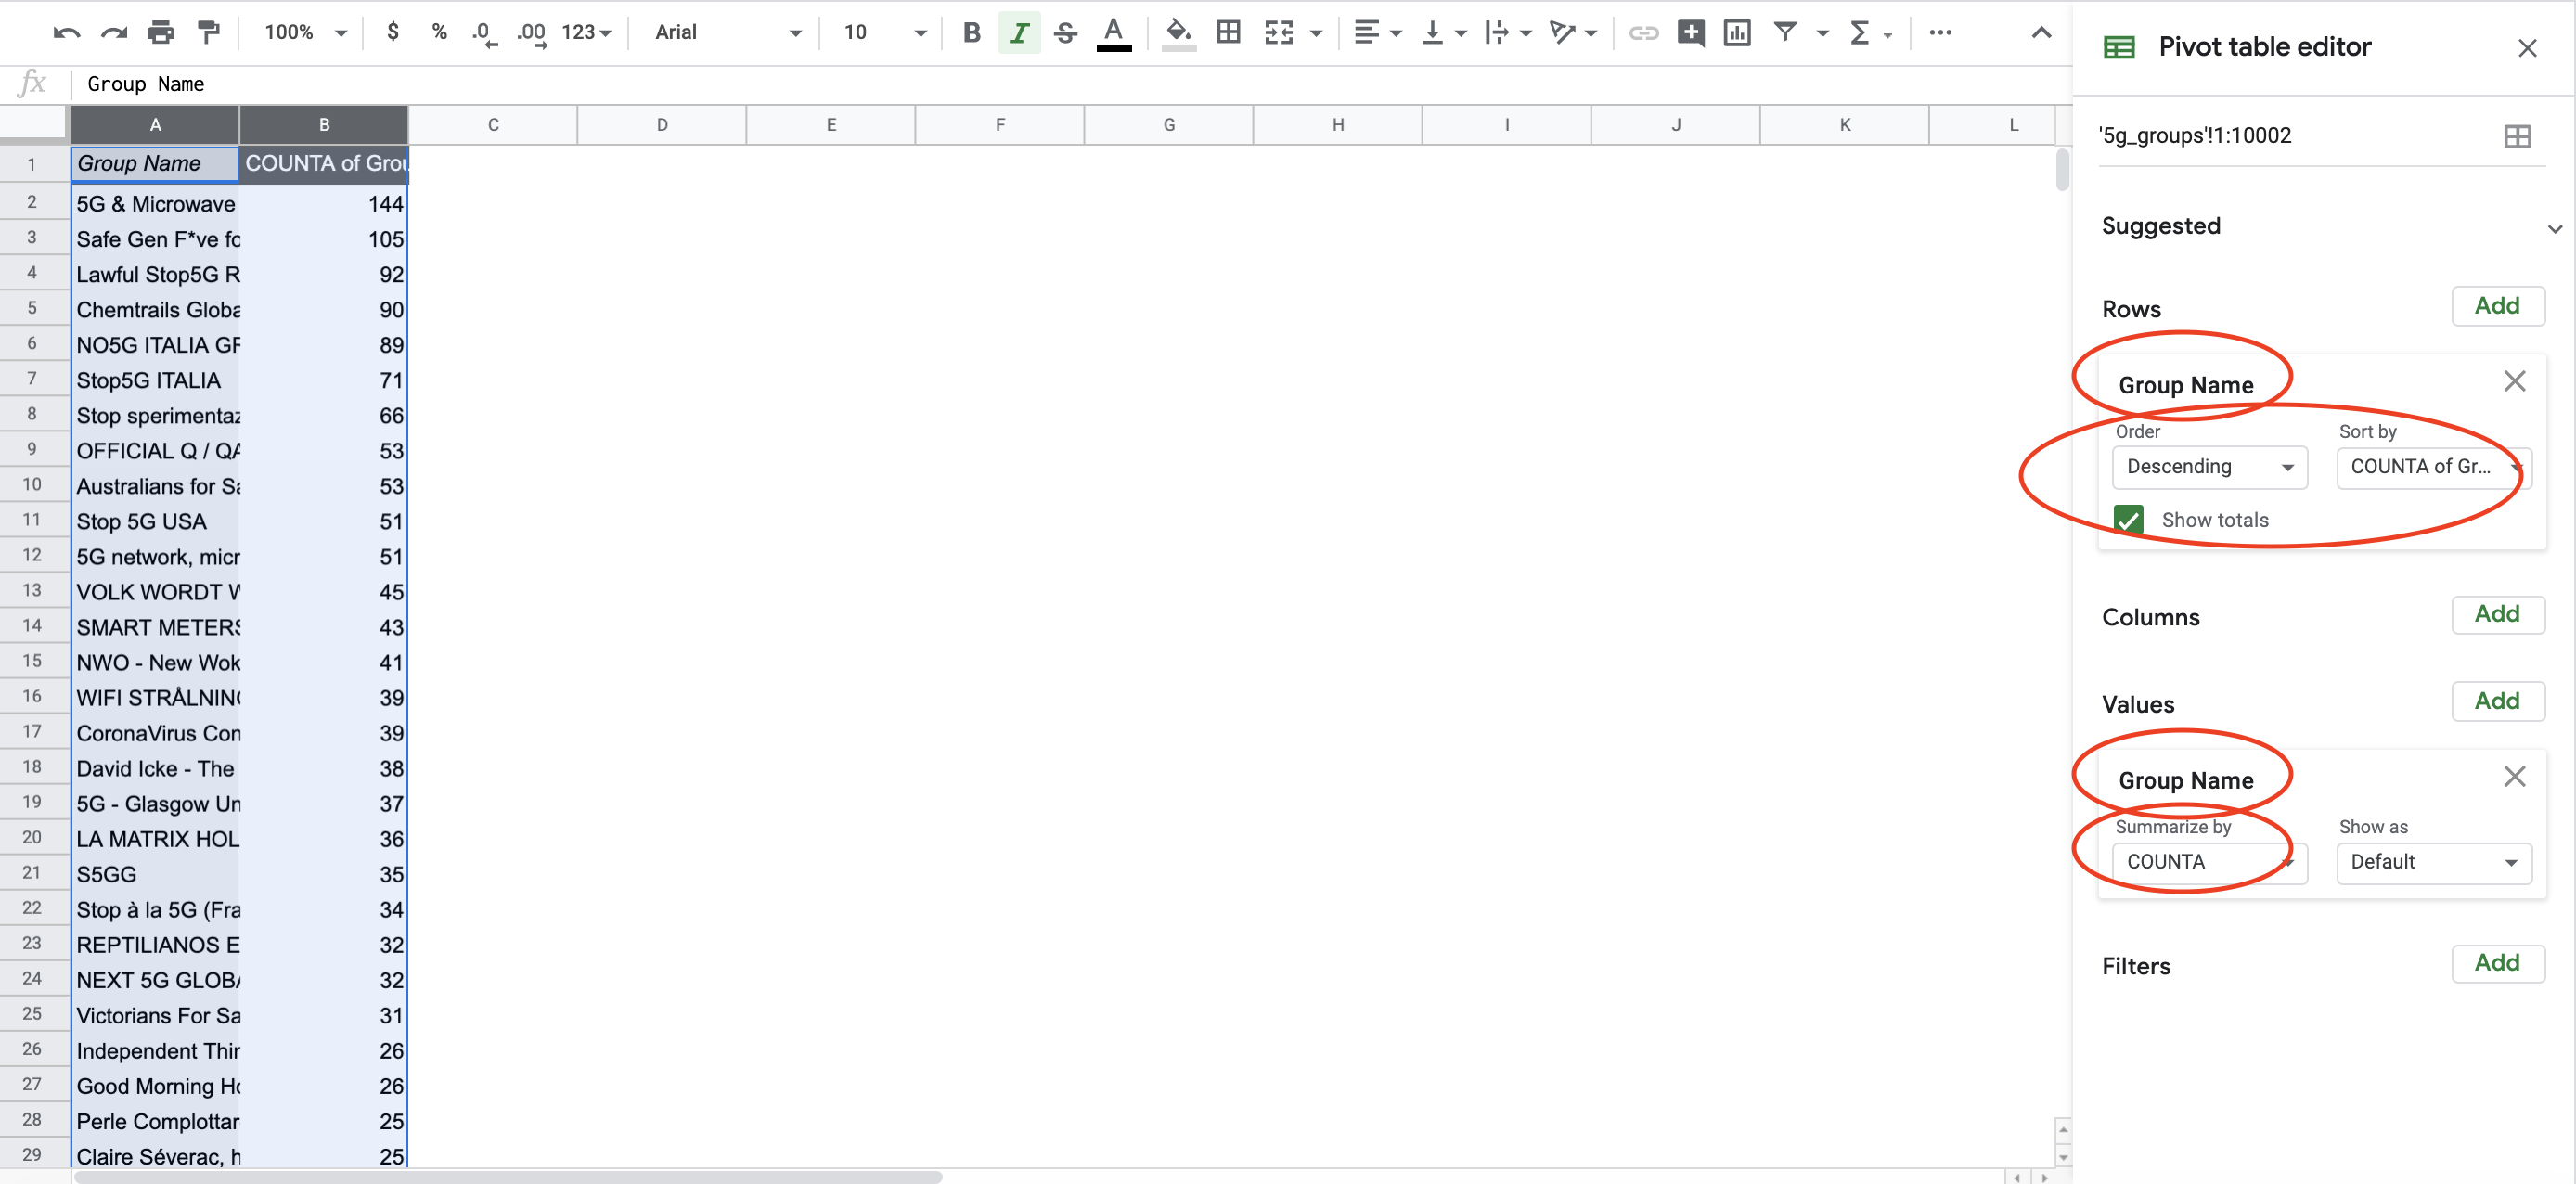
Create a pivot table to obtain the most recurrent Groups in the dataset.
Click on ‘Sort by’ and select the column ‘COUNTA of Group Names’ and descending order. This gives us a quick overview of who is posting the most about this topic.
We can repeat the same operation with the ‘Links’ column to see the most common links in the dataset:
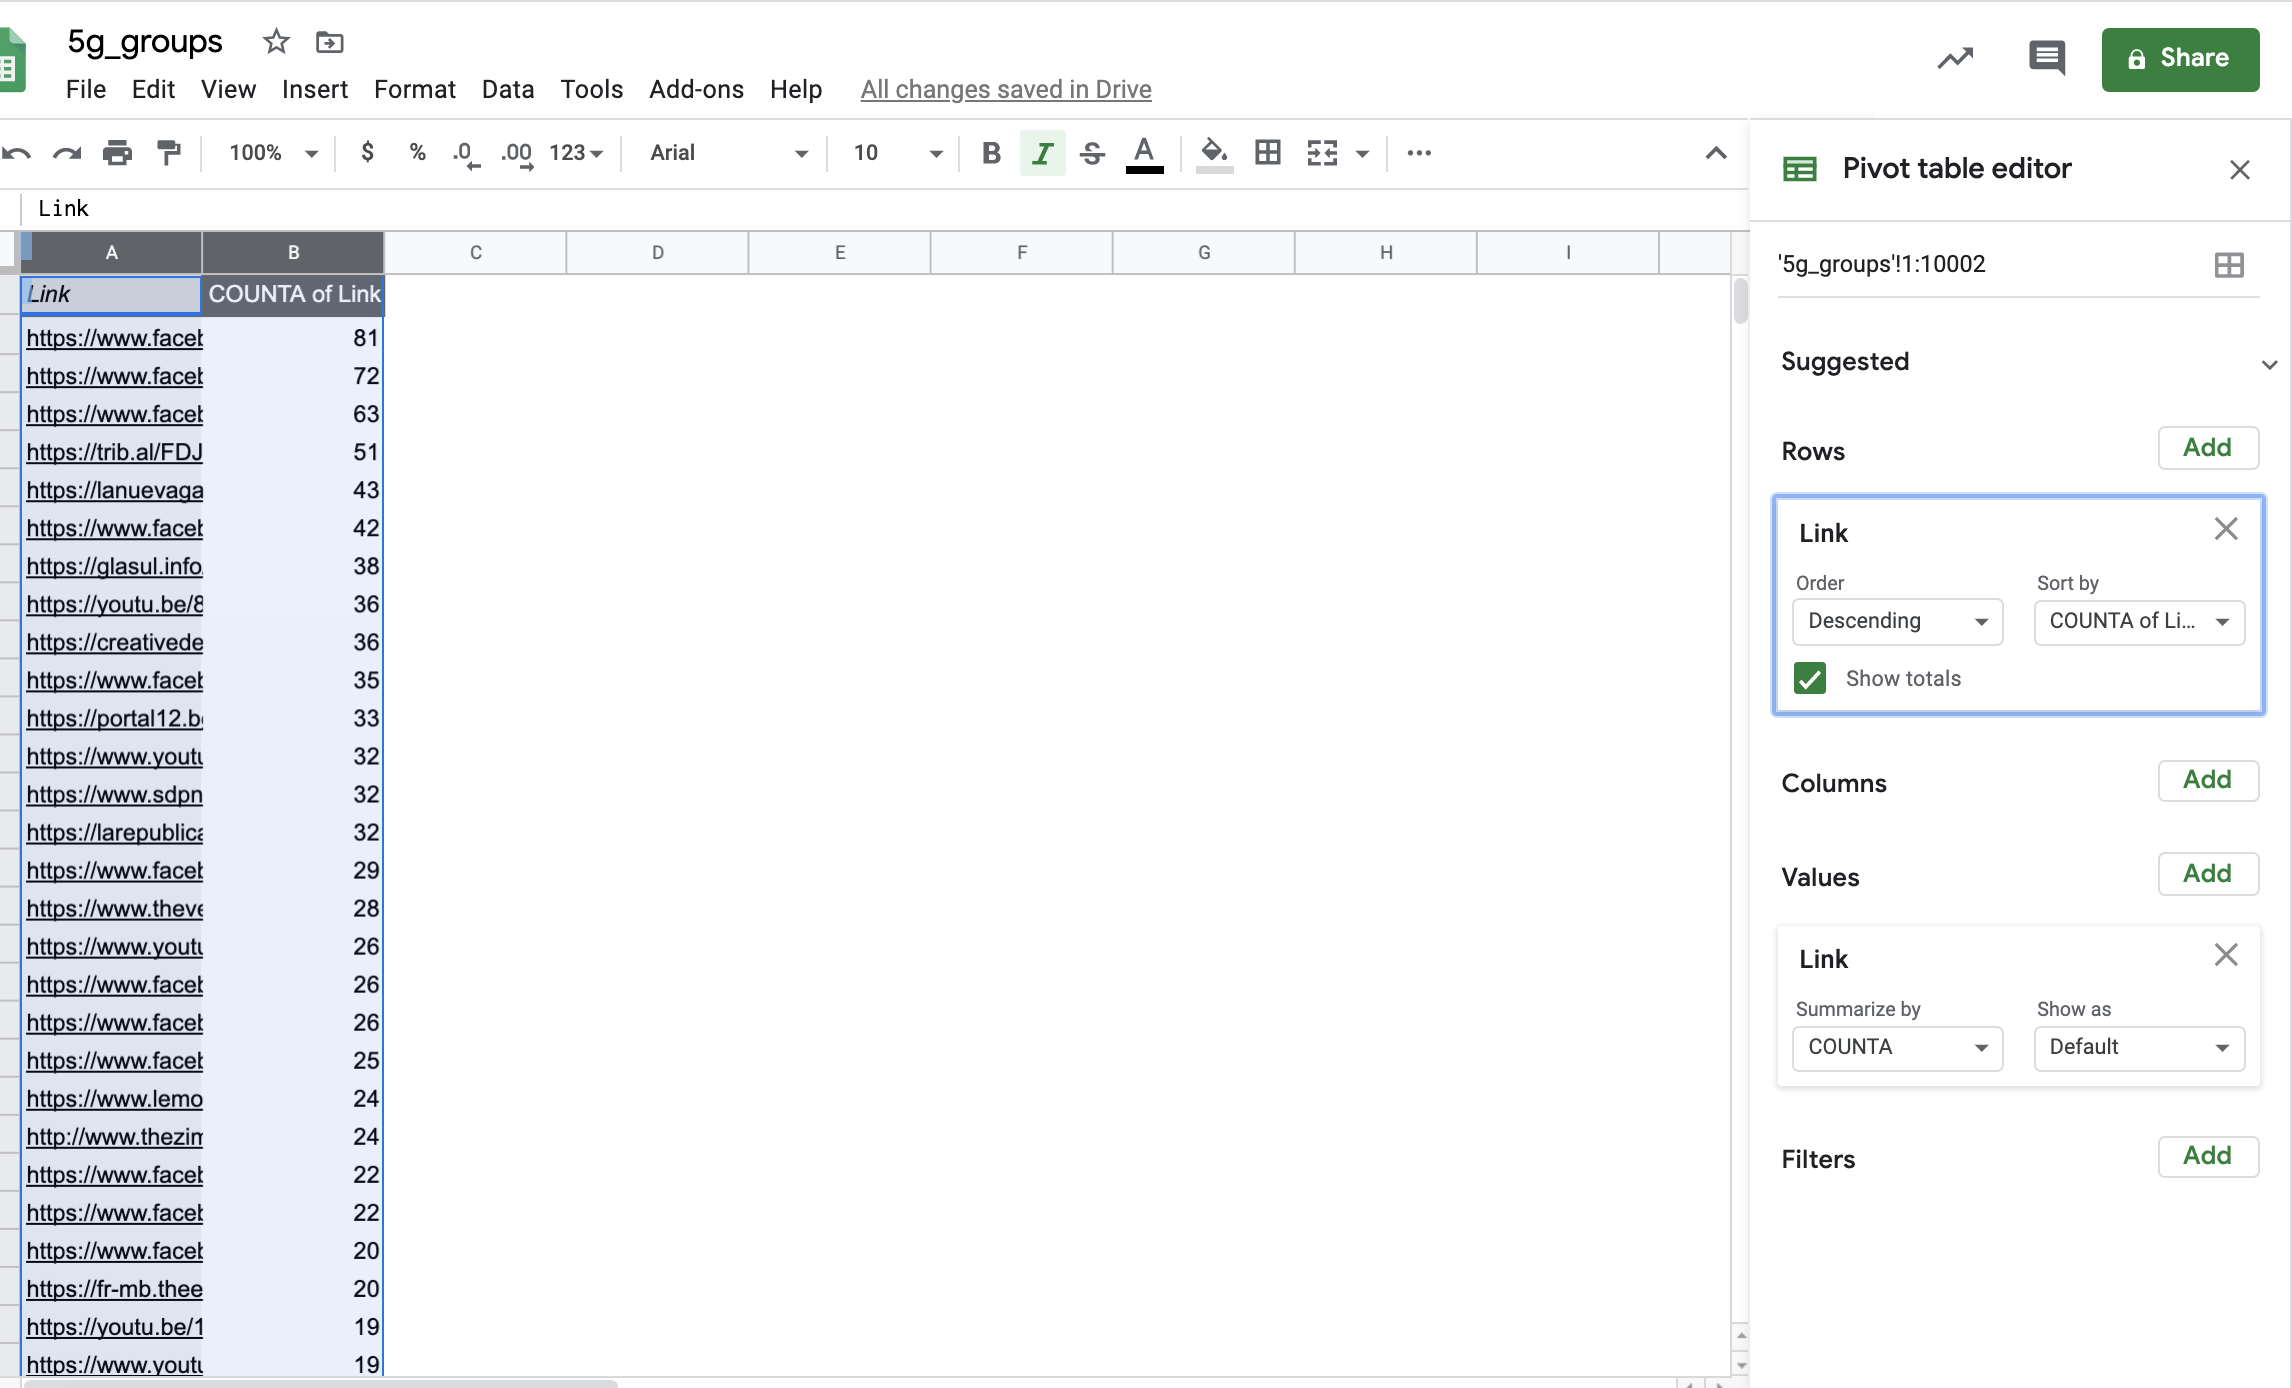
Count the most common links in the dataset.
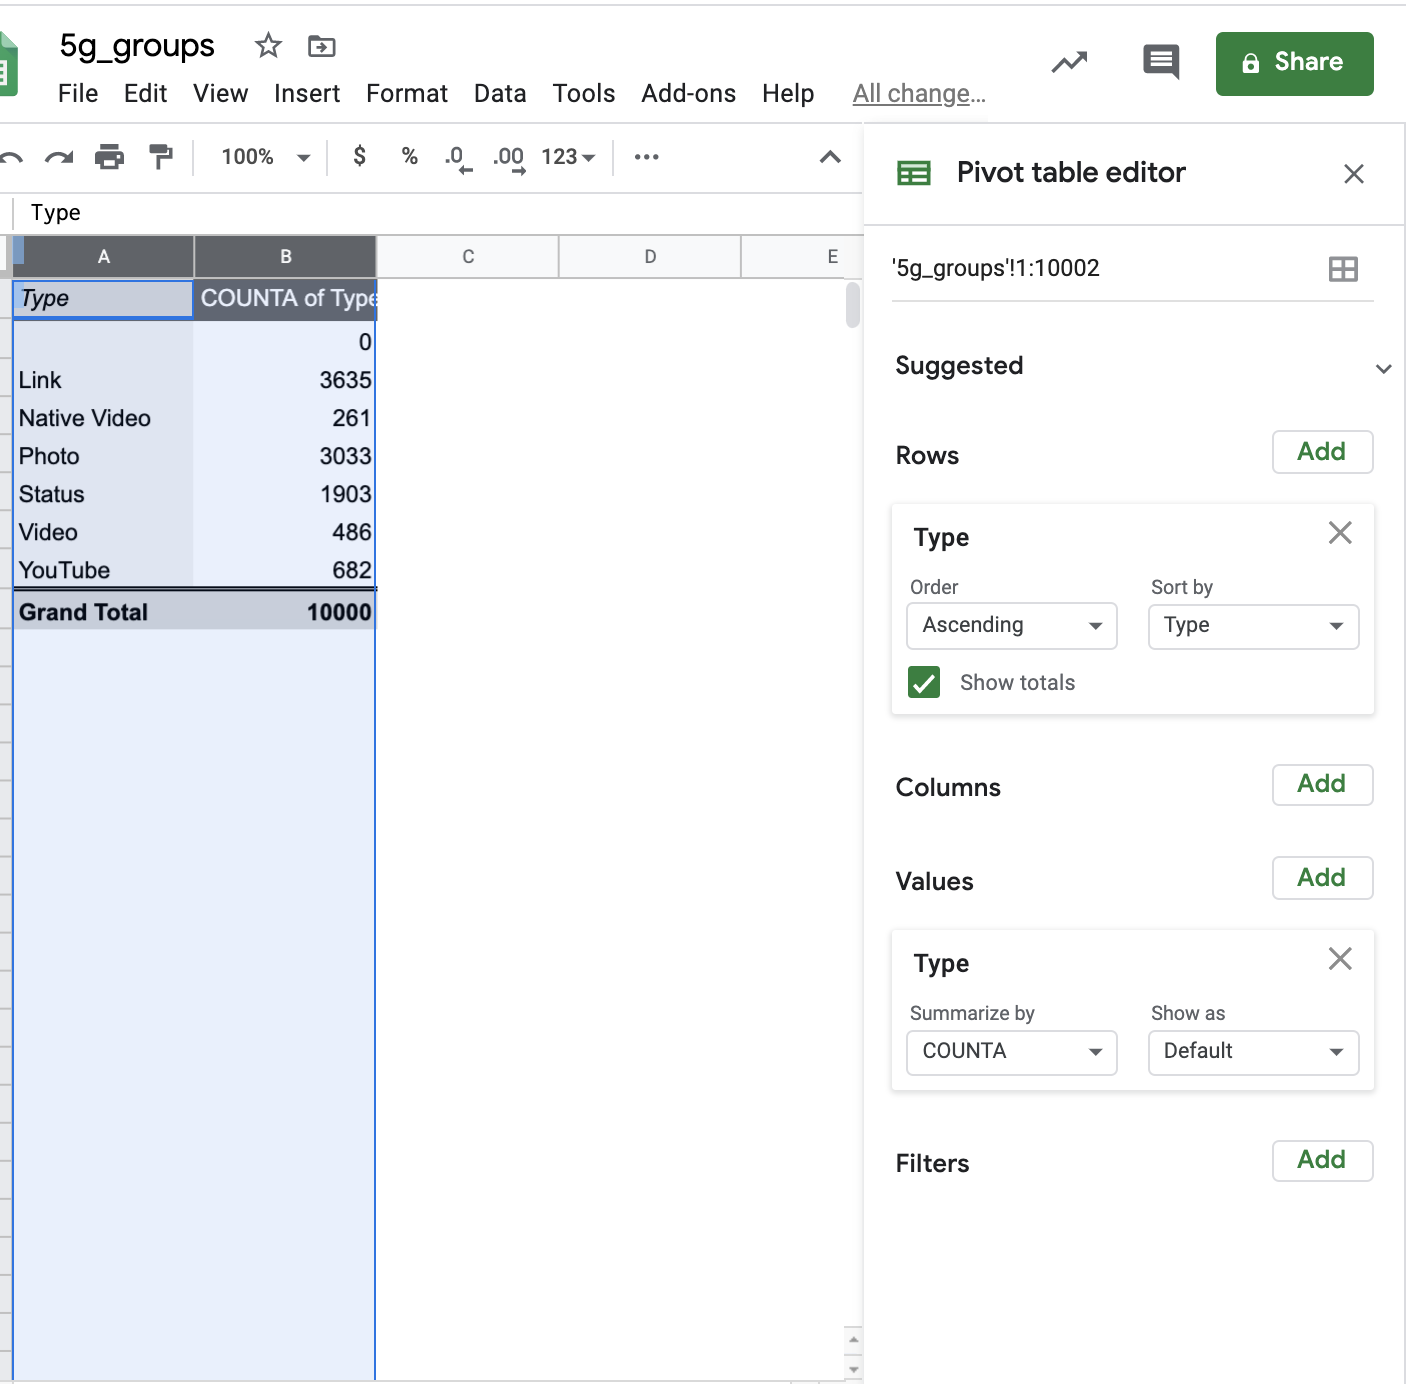
Or with the ‘Media types’ column or ‘Language’:
It is very important to look at trends over time, especially if we want to know whether or not we should publish a debunk or amplify a rumor.
We can do that using a pivot table again which will sum up all shares for each day in the dataset.
CrowdTangle tells us the exact second a post was published as default, so we need to change the time stamp in our spreadsheet to show the date.
For this we need to add two blank columns on the right of the ‘Created’ column. Copy and paste it, and highlight the new one. Then click on ‘Data’ on the top navigation menu and ‘Split text to columns’ and select ‘Space’ as separator; in this way, we will remove the timestamp and leave a clean column with dates only.
Now we can create a new pivot table. Select the new ‘Created’ column within ‘rows’, and the ‘Shares’ column in ‘values’. We then select ‘sum’ under ‘Summarize by’. We can also create a chart out of our data to overlook how it looks like. Click on Insert Chart in the top menu.
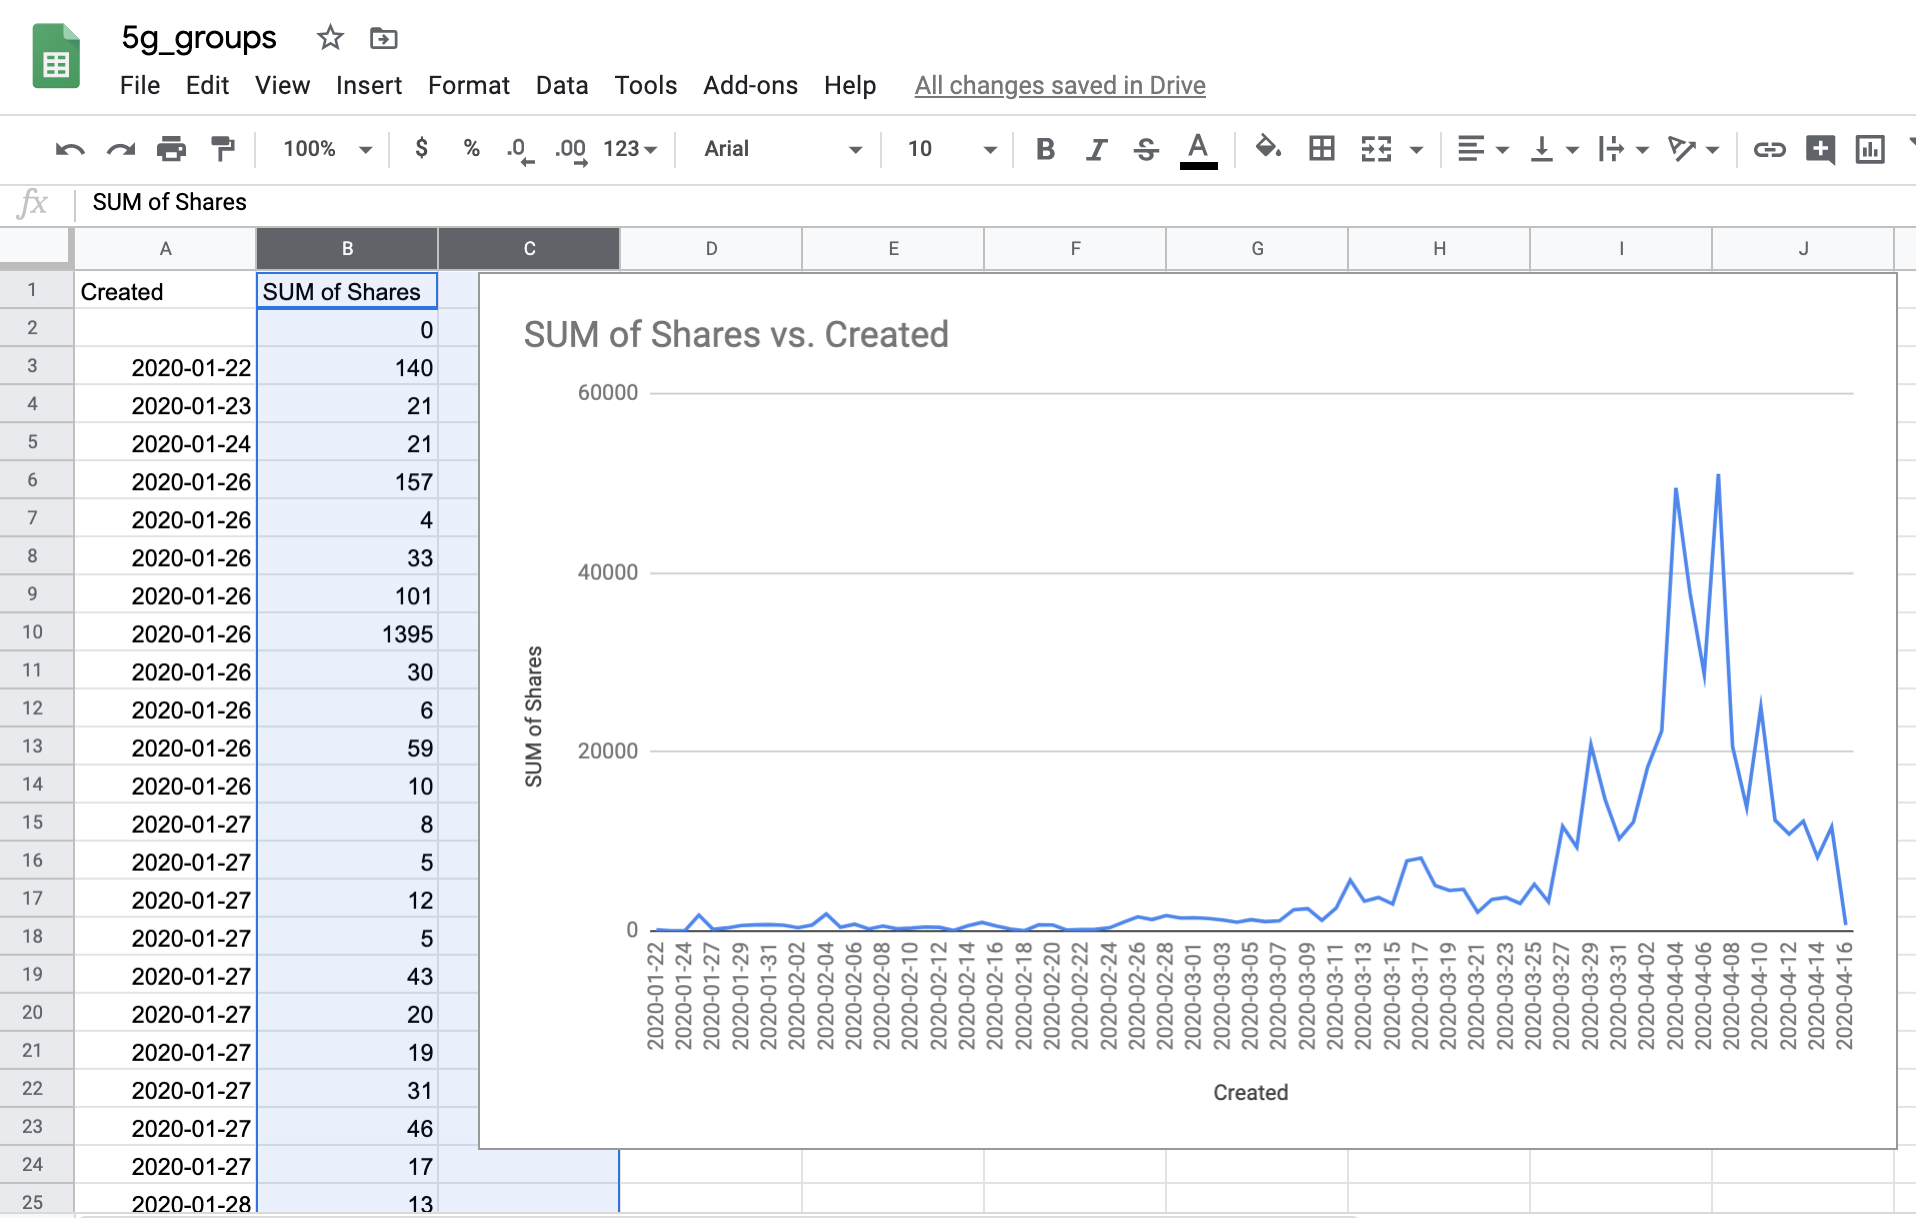
Sum up all shares for each day in the dataset.
As we see in this case, 5G related posts started increasing around the end of March and spiked at more than 40,000 shares per day at the beginning of April.
We can also decide to simply sort the data by the ‘Created’ column, which could lead us to reconstruct a timeline of how and when the content was amplified and reveal the spread of disinformation.
This is just a quick demonstration of some basic actions we can do with CrowdTangle’s Facebook data. We can also use CrowdTangle for Instagram and Reddit, which will give us slightly different — and less detailed — datasets.
Obviously there are many more ways we can clean and analyze the data. What we do will be shaped by the questions we want to ask of it. Understanding the spread of mis and disinformation is hard but using data to ask the right questions is a solid first step.
Stay up to date with First Draft’s work by becoming a subscriber and follow us on Facebook and Twitter.