
This recipe is the sixth in our Digital Investigations Recipe Series, a collaboration between the Public Data Lab, Digital Methods Initiative, Open Intelligence Lab and First Draft. It is designed to lift the lid on advanced social media analysis.
Introduction
Tracking the spread of misleading or outright false narratives is one part of investigating misinformation, but how can journalists and researchers unearth and identify the evidence that communities use to substantiate a rumor or falsehood? And to where else has this content traveled?
The following recipe will detail how you can unearth and snowball the “factual” evidence — in this case URLs — used by different communities on 4chan, 8kun and Reddit to construct and substantiate conspiracy theories, misinformation and false narratives across the web. Through gathering the URLs being shared around certain issues, you will be able to map their relation — the connections between websites — track the cross-platform dissemination of these same URLs and better understand the tactics being employed by certain communities to build narratives.
Ingredients
1. 4CAT. 4CAT is a dashboard-like tool that scrapes data from Reddit, 4chan, 8chan, 8kun, Breitbart, Instagram, Telegram and Tumblr. It hosts a suite of natural language processing and other statistical tools designed to facilitate the study of social media content and misinformation. The tool is free and there are detailed instructions on how you can install 4CAT on your own computer or server.
2. Google Sheets as a spreadsheet editor.
3. Raw Graphs or other data visualization software.
4. Gephi: http://gephi.org/. Gephi is an open-source network visualization tool used to explore the different links and communities in your data.
Steps
1. If you haven’t already, build a cross-platform dataset with 4CAT. We will be using the same dataset that we curated in the recipe Tracking the cross-platform spread of harmful and misleading narratives
? See steps 1-15 of Tracking the cross-platform spread of harmful and misleading narratives
2. Using your new “meta” spreadsheet (where you have merged your datasets from 4chan, 8kun and Reddit), extract URLs out of posts by using the formula below in an empty cell. The formula value “C2” needs to point to the column post body (where the content of the post is located) .
=REGEXREPLACE(JOIN(“”,ARRAYFORMULA(IFERROR(REGEXEXTRACT(SPLIT(C2,” “,TRUE,TRUE),”http(\S+)”),””))),”\s+”,” “)
3. Then, split the rows where the URLs are contained. As you go over Data >> Split text to columns in Google Sheets, select “s://” as a delimiter.
4. What are users saying about the evidence or links they have included in their posts? Sort your new URL column (A>Z), and then sort timestamps (A>Z). That way, you can see when URLs were posted over time, and what evidence was used to construct or defend these narratives. Closely read posts containing URLs.
For example, we see that one of the first URLs posted in connection to this narrative was not from some obscure alternative news outlet, but from The Guardian. Ironically, articles by established news media reporting on a specific conspiracy theory, health issue or piece of misinformation will be used as evidence to support the agenda of certain communities.
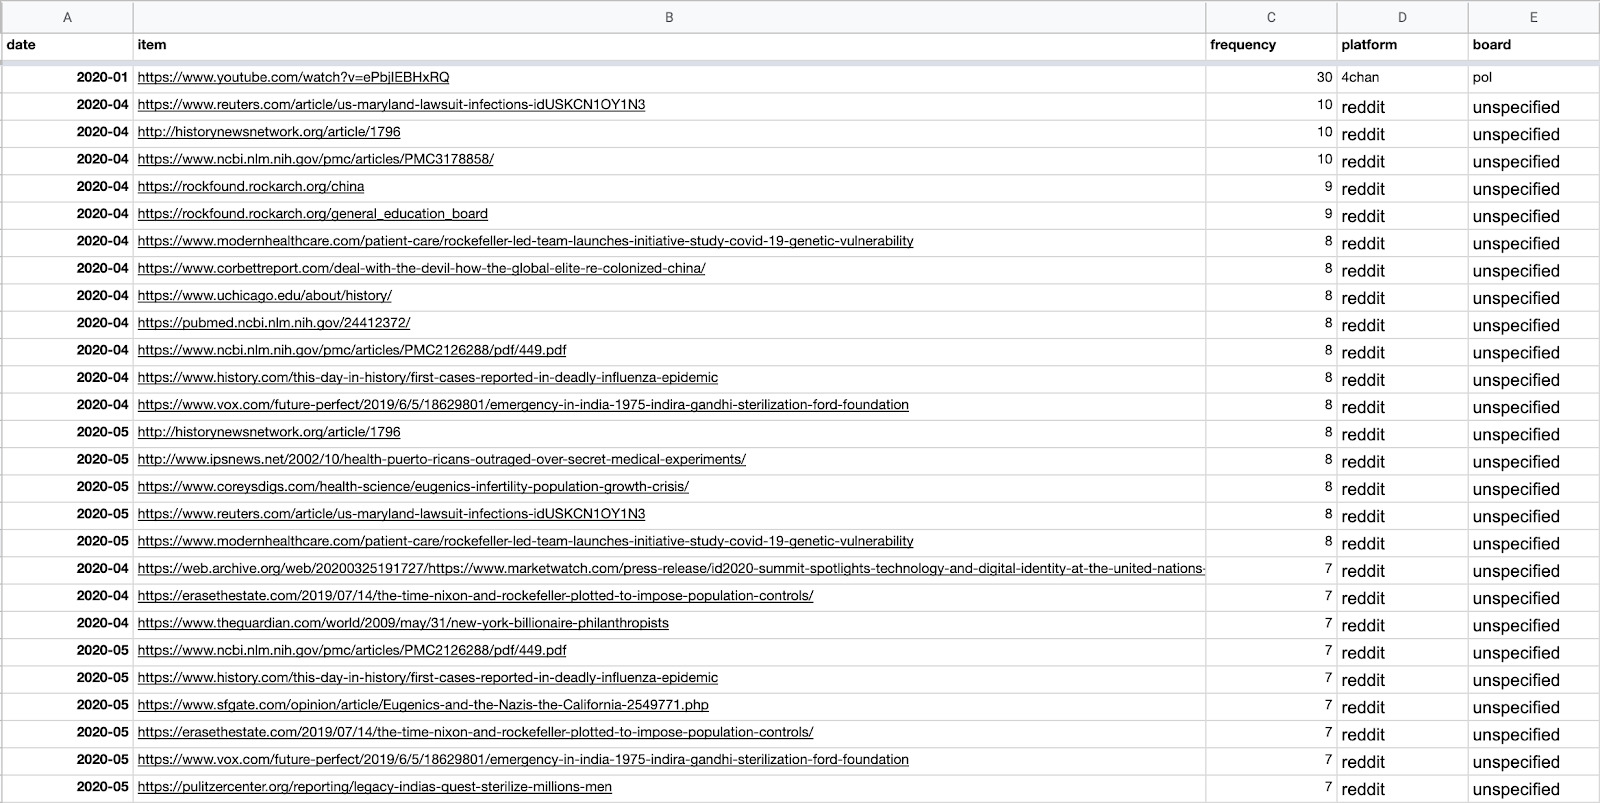
5. We determined in Tracking the cross-platform spread of harmful and misleading narratives that discussions around vaccines and population control increased around March and June of 2020. Let’s check what URLs were posted at that time across all platforms. On 4CAT, under Post metrics, select Attribute frequencies. Select URLs as an attribute to aggregate, and then select Months as intervals.
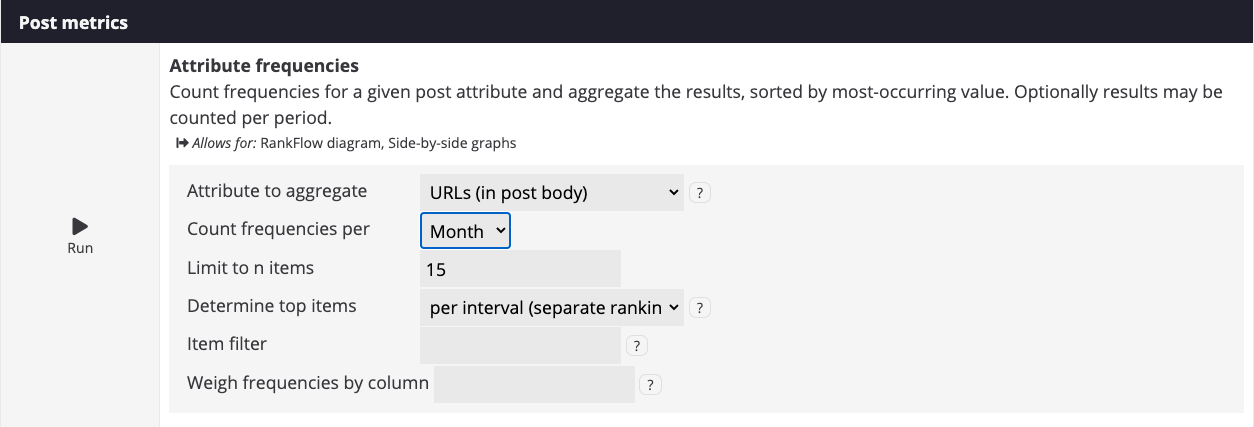
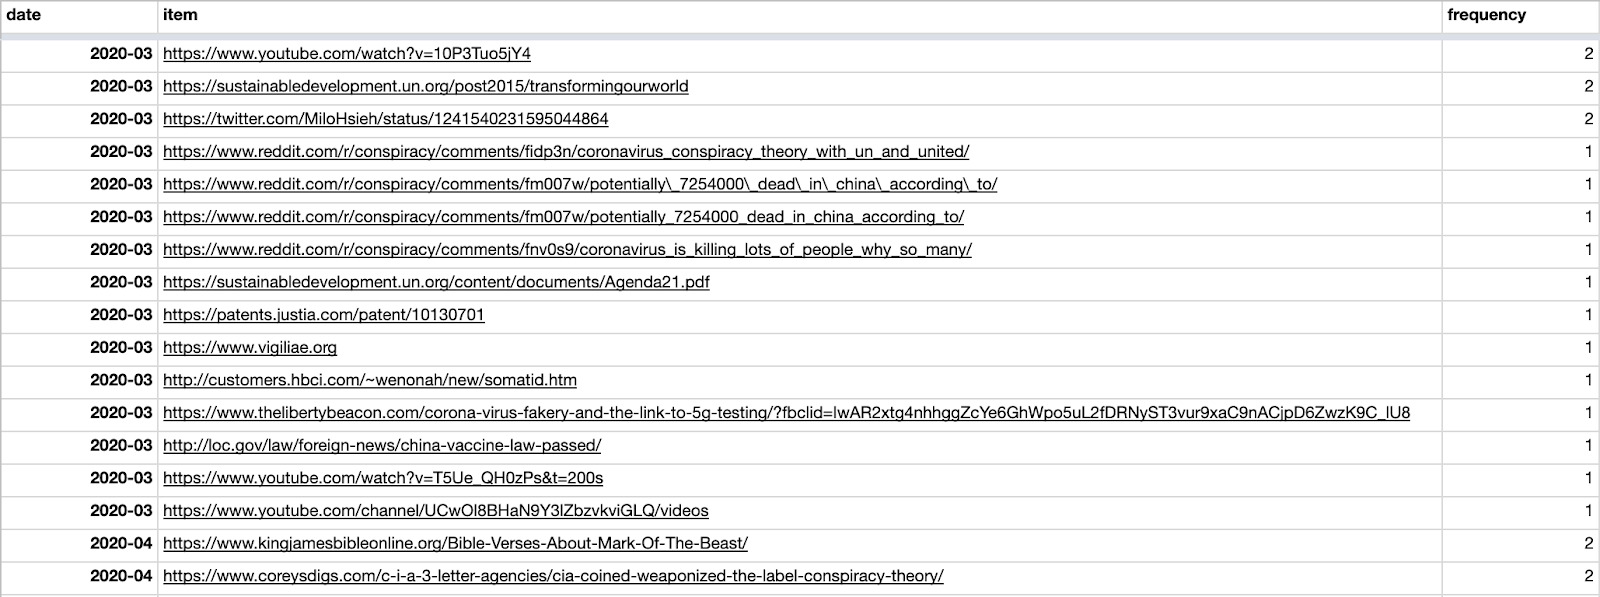
Your results will look like this.
6. Just as you did in Tracking the cross-platform spread of harmful and misleading narratives, create two additional columns for platforms and boards, and then paste results from other platforms.
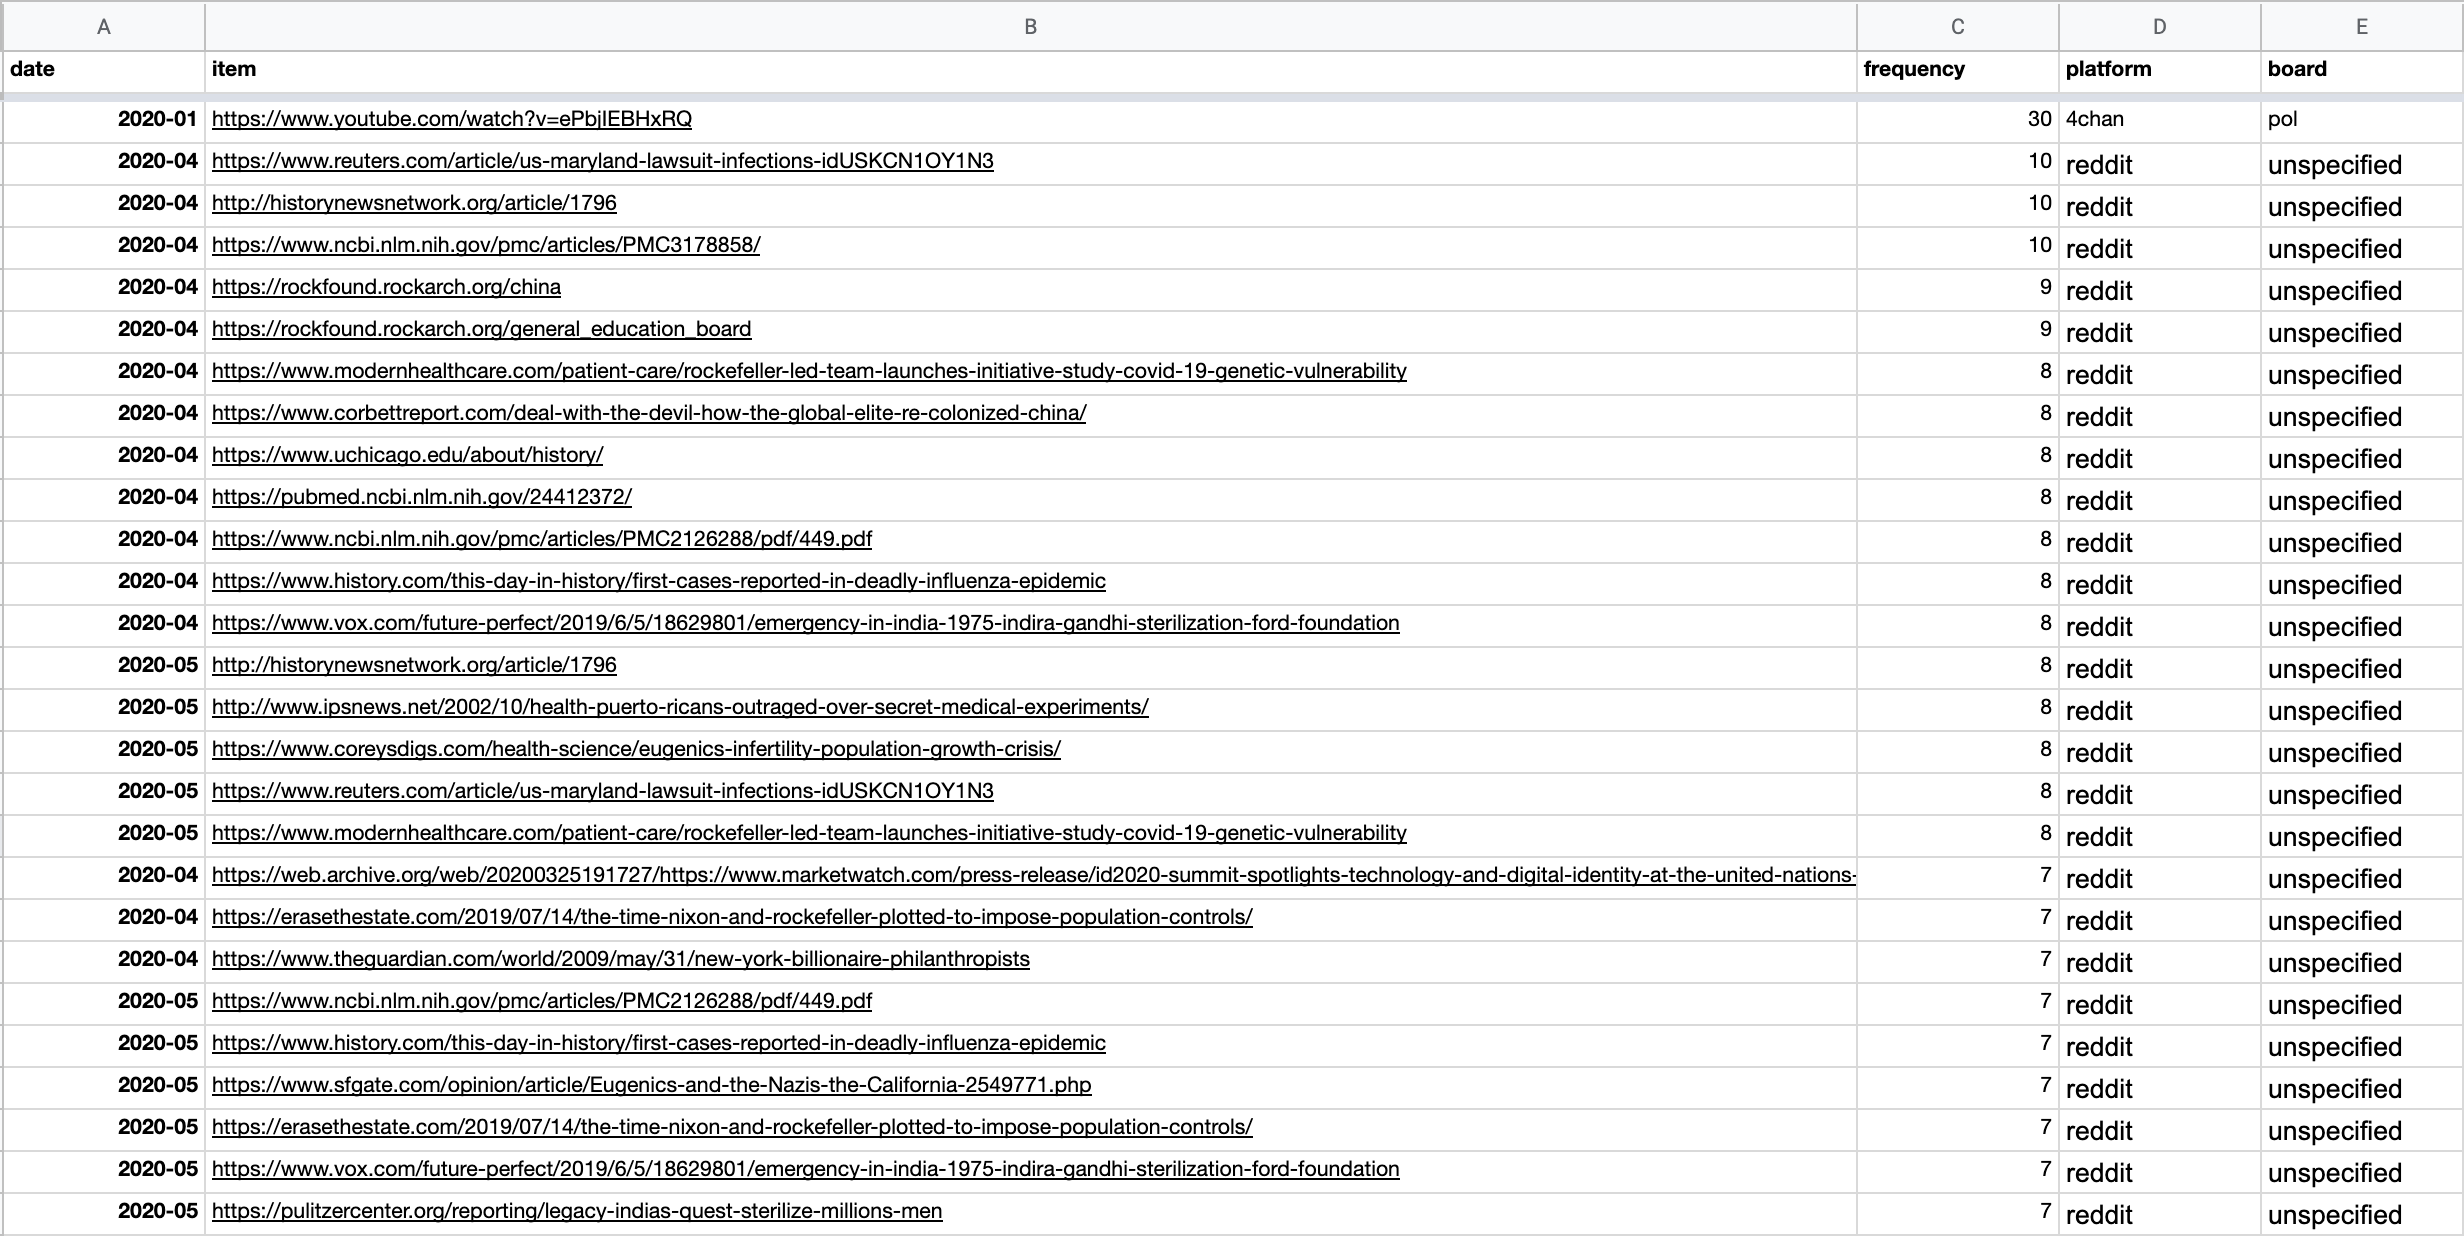
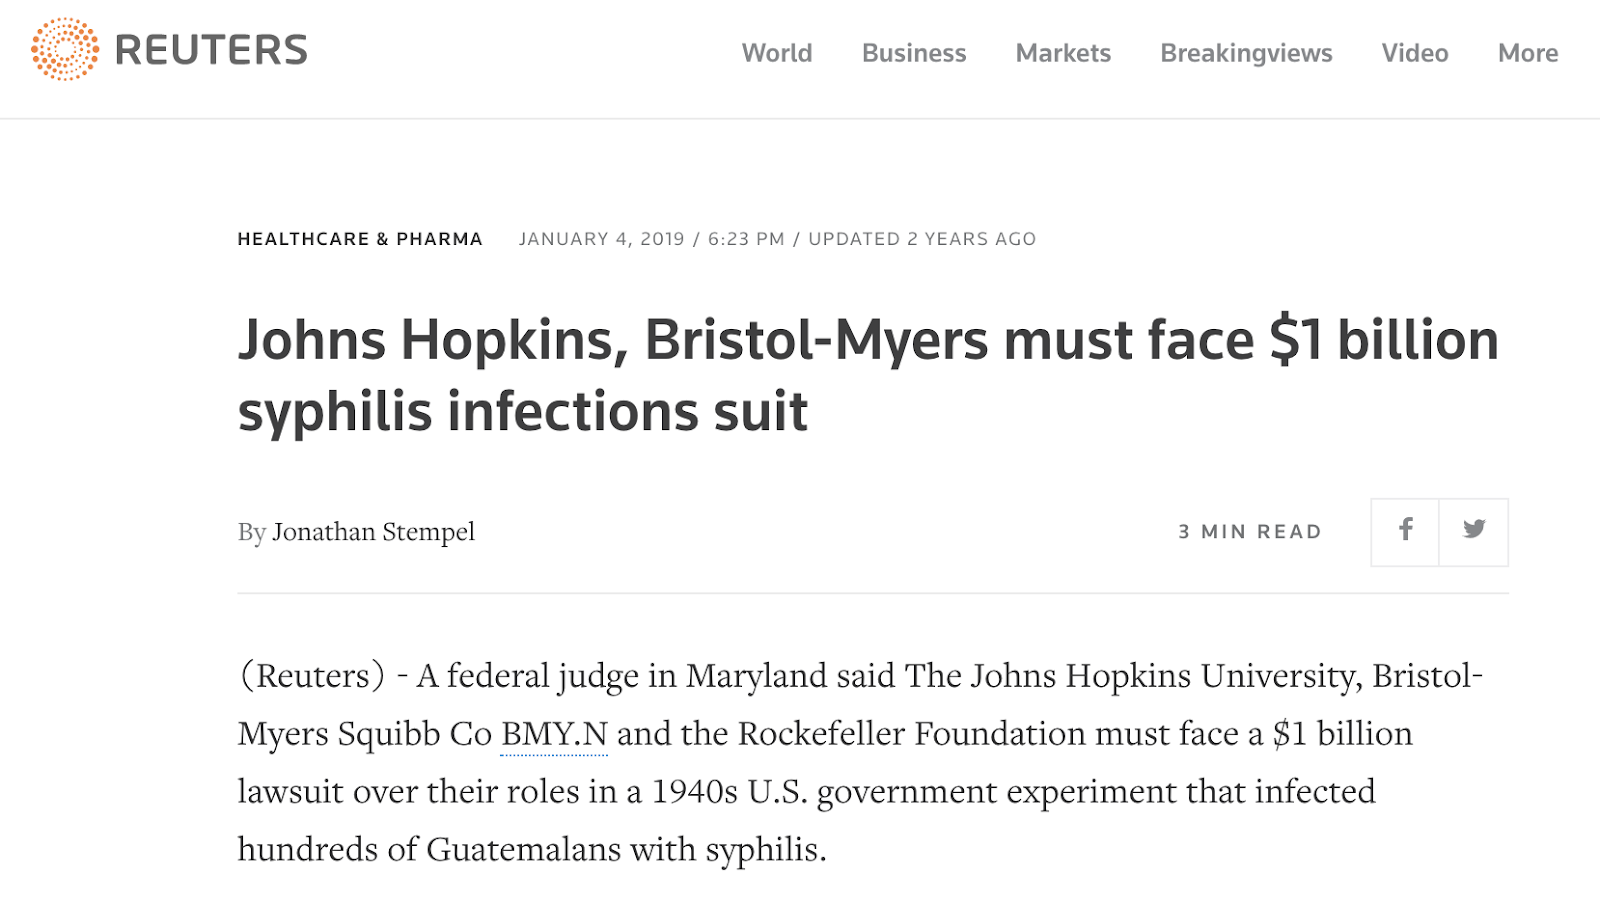
7. Inspect the URLs posted between March and June 2020. We see that one of the most frequently posted URLs (on Reddit) was an article from Reuters, claiming that Johns Hopkins and Bristol Myers Squibb “must face $1 billion syphilis infections suit.”
We can also sort the column containing frequencies from Z > A to see the most-posted URLs.
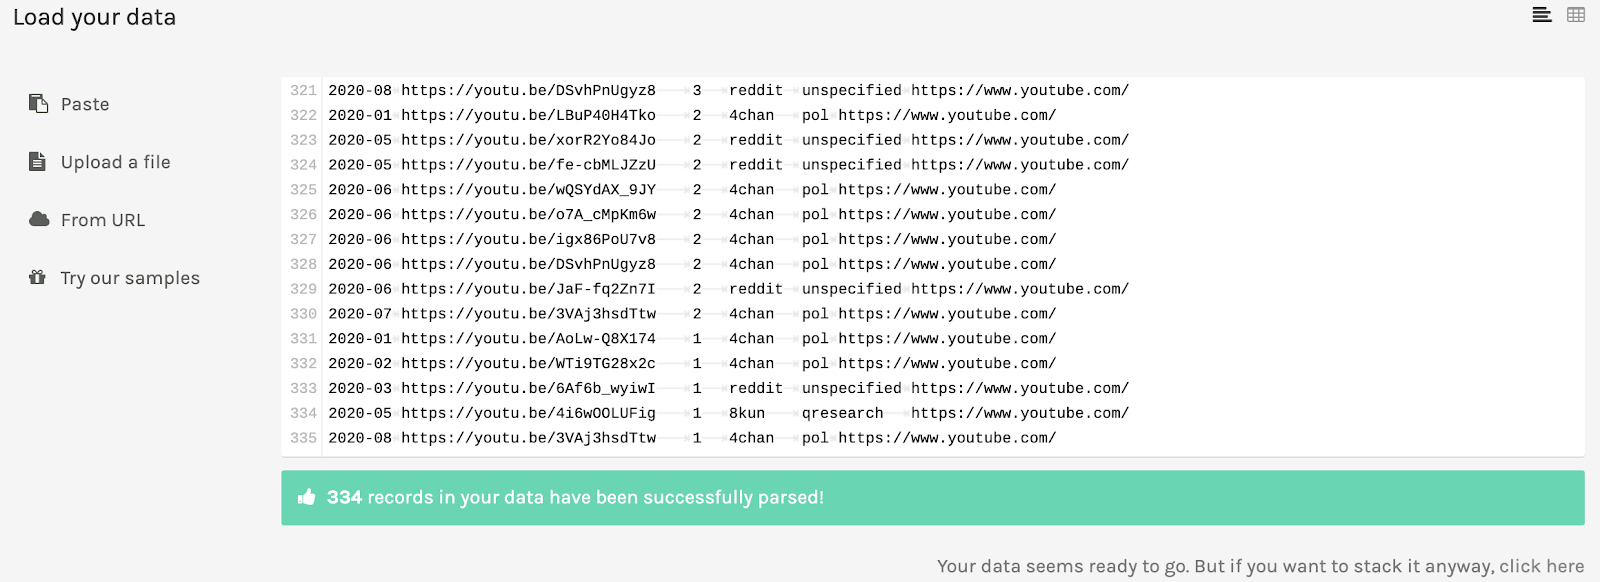
We can see that one specific YouTube video was very popular on 4chan/pol. If we search for that URL in our original “meta spreadsheet,” we can see it in context: One user appears to have posted it again and again in a tirade about a “shadow feudal government.” You can use the same approach for any of the URLs. The same can be done with the Reuters article, as well as with any other URL to see whether it was one person or a variety of users sharing the link.
8. Which URLs or domains are most shared across platforms? Go back to your URL spreadsheet and create an additional column for domains.
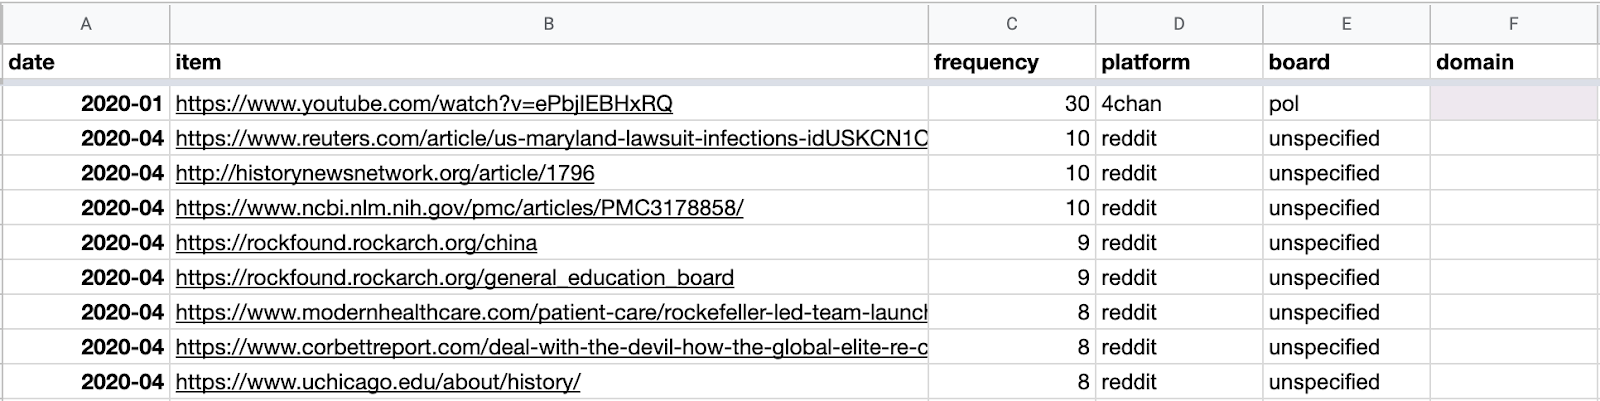
In the domain column, insert the following function:
=trim(REGEXEXTRACT(REGEXREPLACE(REGEXREPLACE(B2,”https?://”,””),”^(w{3}\.)?”,””)&”/”,”([^/?]+)”))
B2 refers to the column containing the urls.
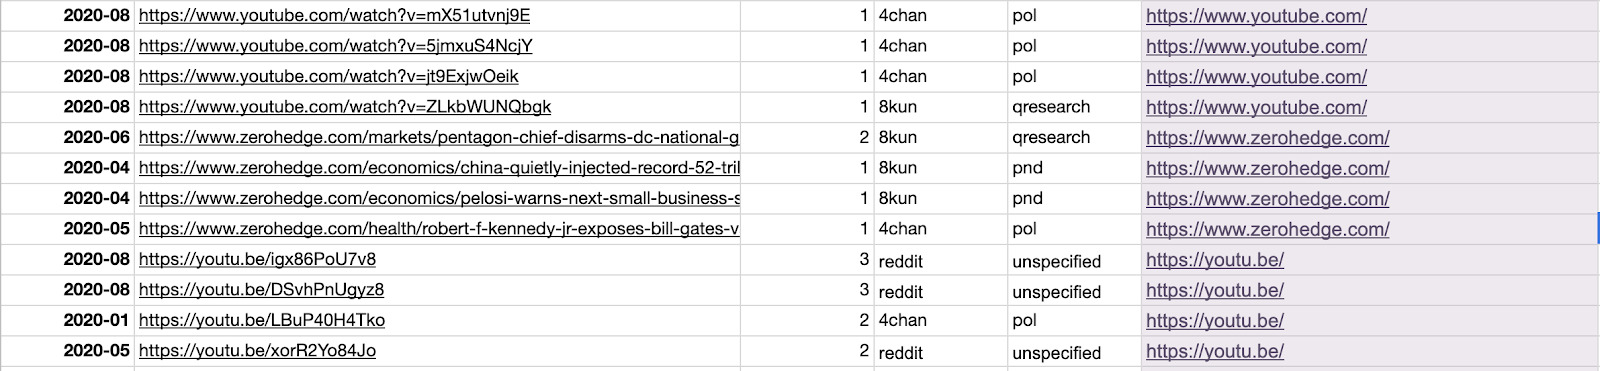
9. Make sure that different domains for the same site are written in the same way. For example, https://www.youtu.be should be https://www.youtube.com.
To bulk-change them, copy and paste domains as values in another column.
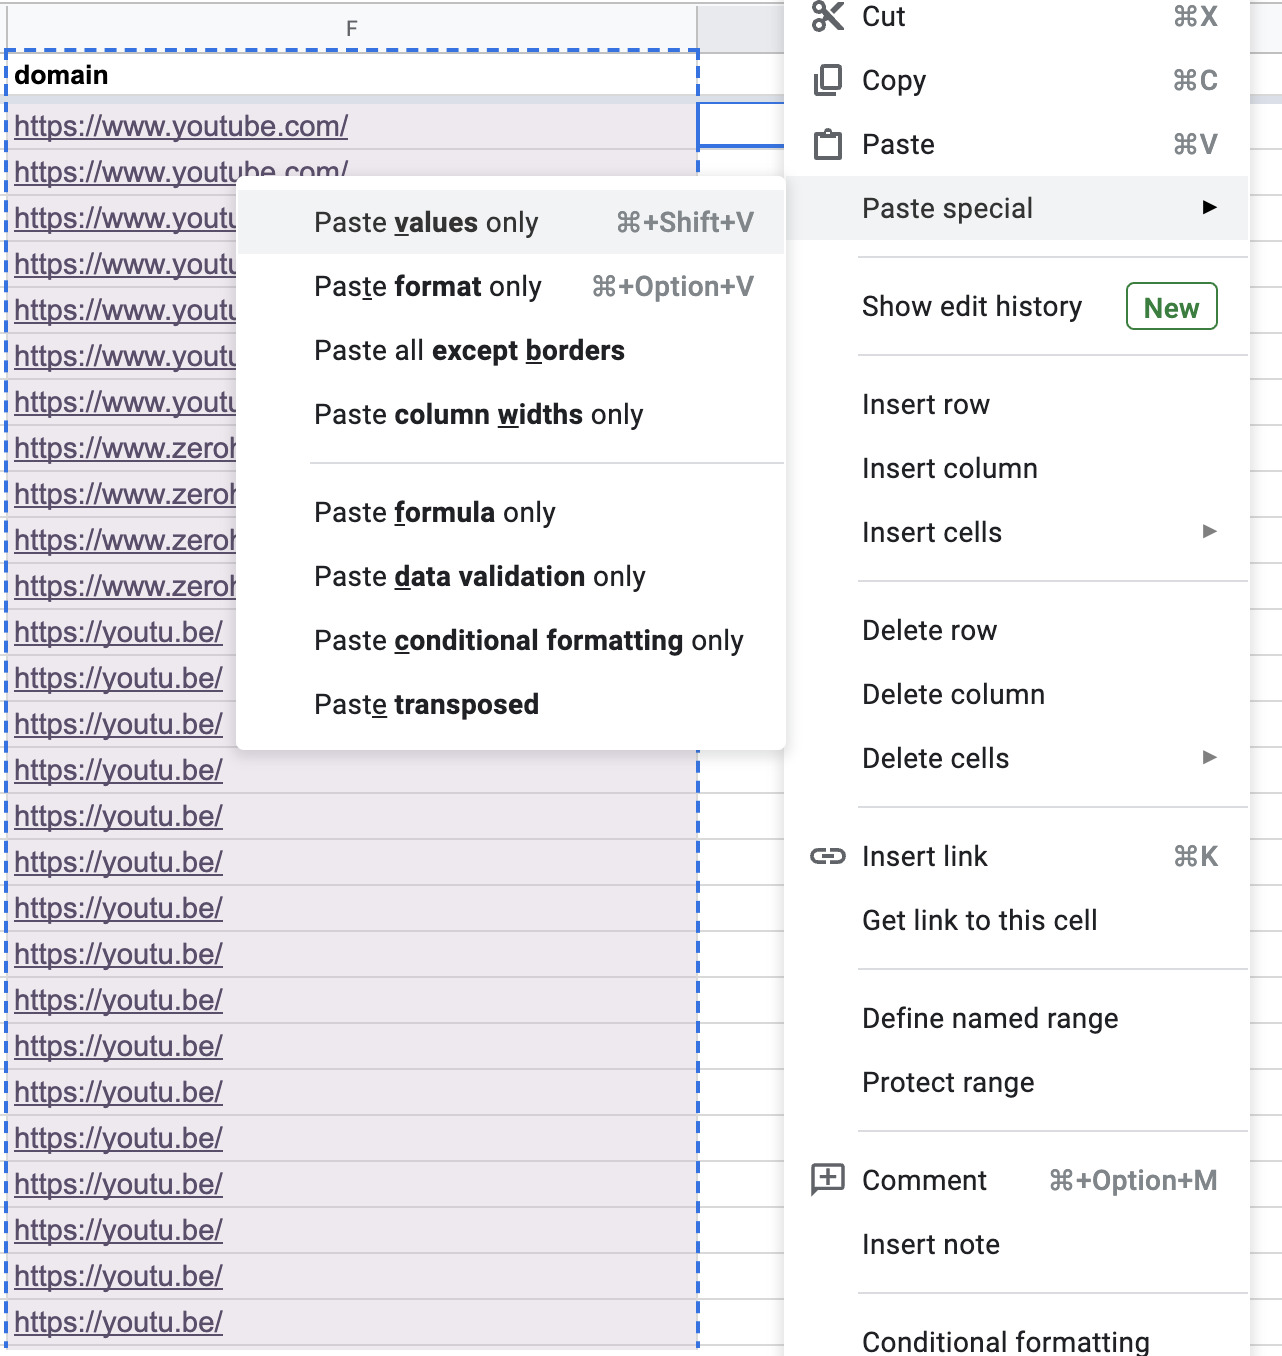
Then sort the column either (A–>Z) or (Z–>A), type in https://www.youtube.com in the first instance of https://www.youtu.be and then drag that value until you reach the last instance of https://www.youtu.be.
10. You may also manually code each domain by type, as we did below. Later, you can use this column to color-code posts by media type.
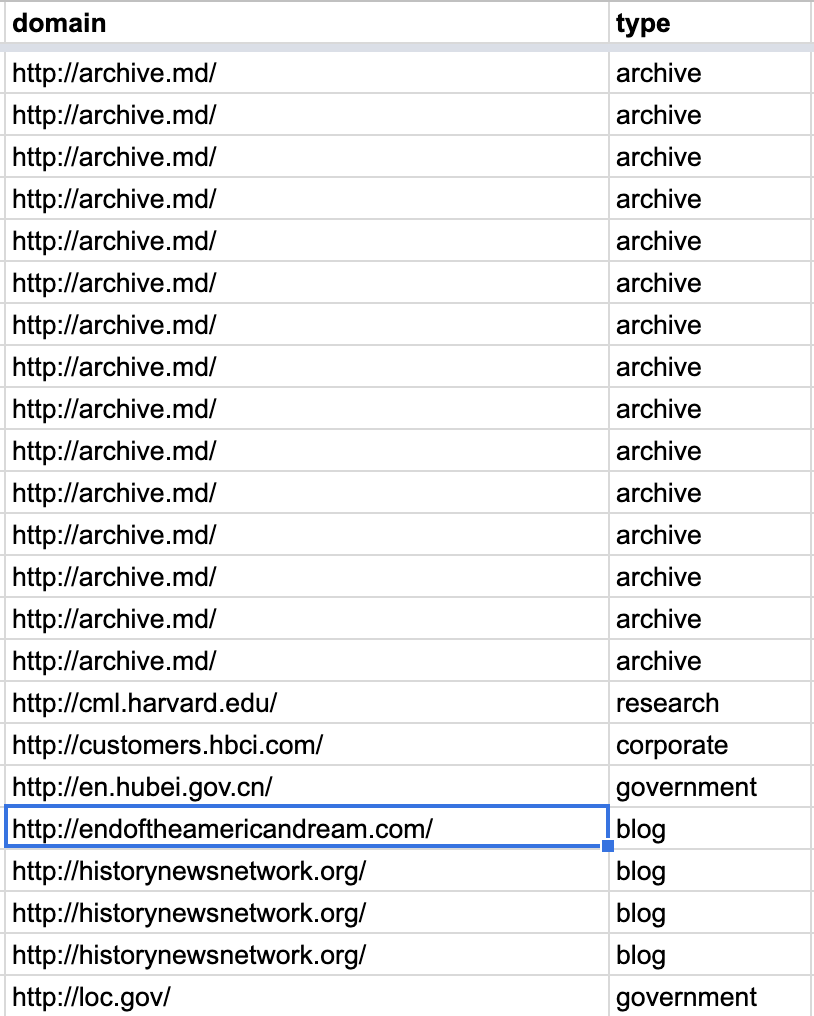
- Now, copy your entire spreadsheet and paste it on Raw Graphs.
11. Choose a Beeswarm graph. Use platforms as Groups, date as X Axis, frequency as Radius and domain or type as Colors. We have used domain as colors. However, note that if you have too many domains, Raw Graphs will run out of options for coloring.
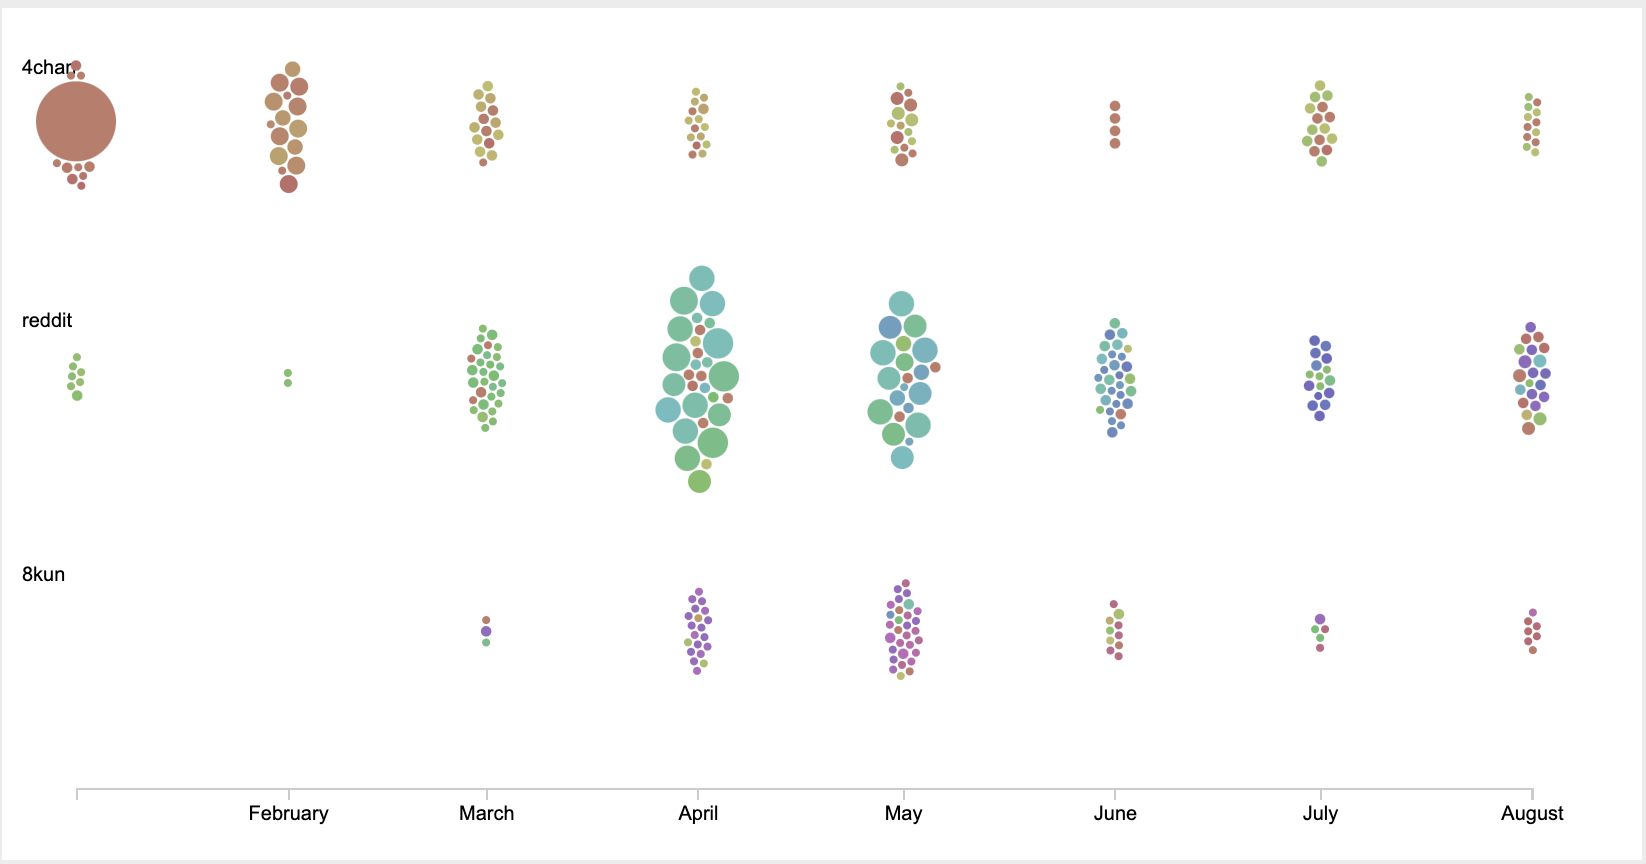
On first sight, we notice that 4chan, Reddit and 8kun have quite distinct media diets. They do not always share the same sources as evidence when building up narratives about vaccines and population control, except toward August. We also see that nearly all platforms increased URL post activity around April.
? If you would like more granular results, in step 5, obtain URLs per day or weeks instead of months.
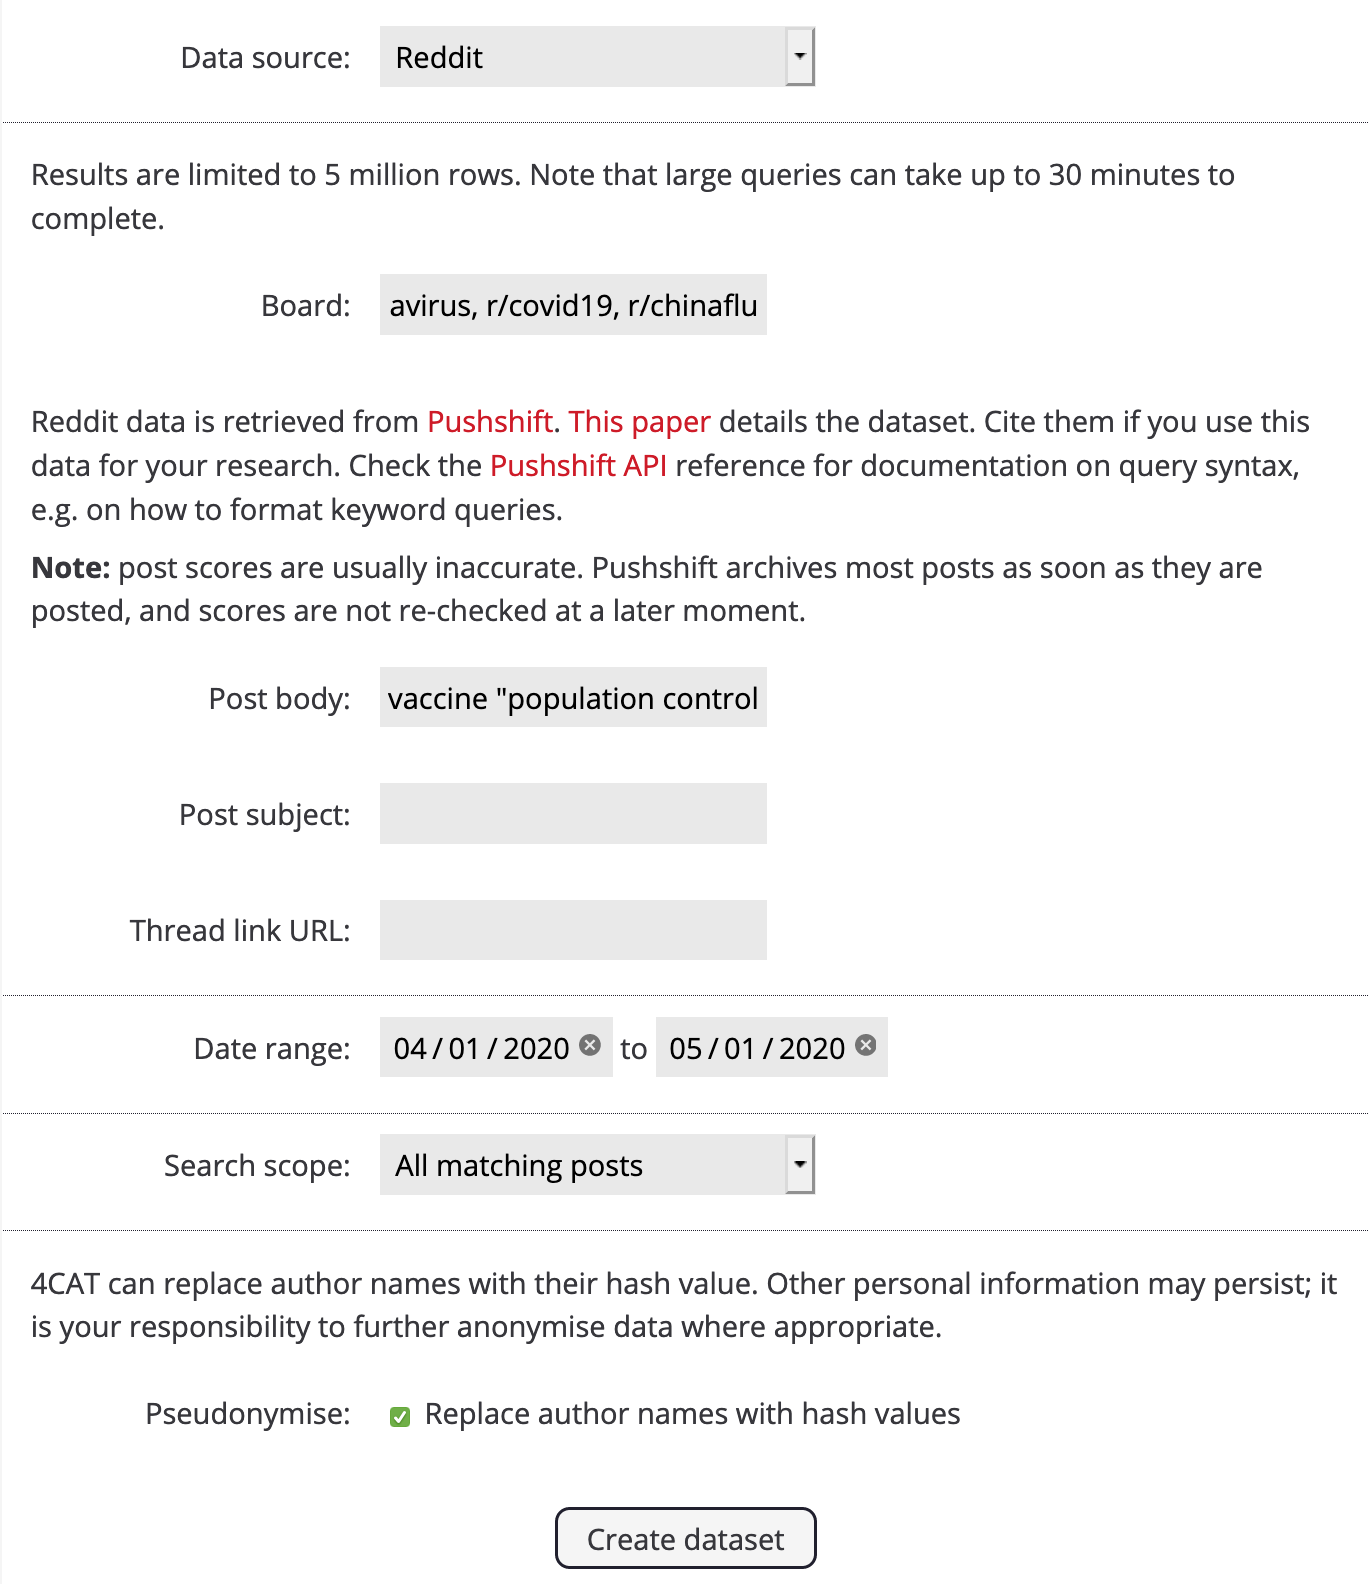
12. What happened in April and what kinds of URLs were being shared? Go back to 4CAT and re-query a given dataset for that specific timeframe. We will use Reddit for this example and the same boards as before. Our query will remain the same, but we will adjust the date range so it goes from 4-1-2020 to 5-1-2020 (MM-DD-YYYY).
14. Once your dataset is ready, go to the Analysis page. Under Networks, select the module URL co-link network and choose between full url or domain name. Co-occurrence context determines how the URLs are going to be linked: Is it by co-occurrence in a post, or in a whole thread? It’s up to you to decide.
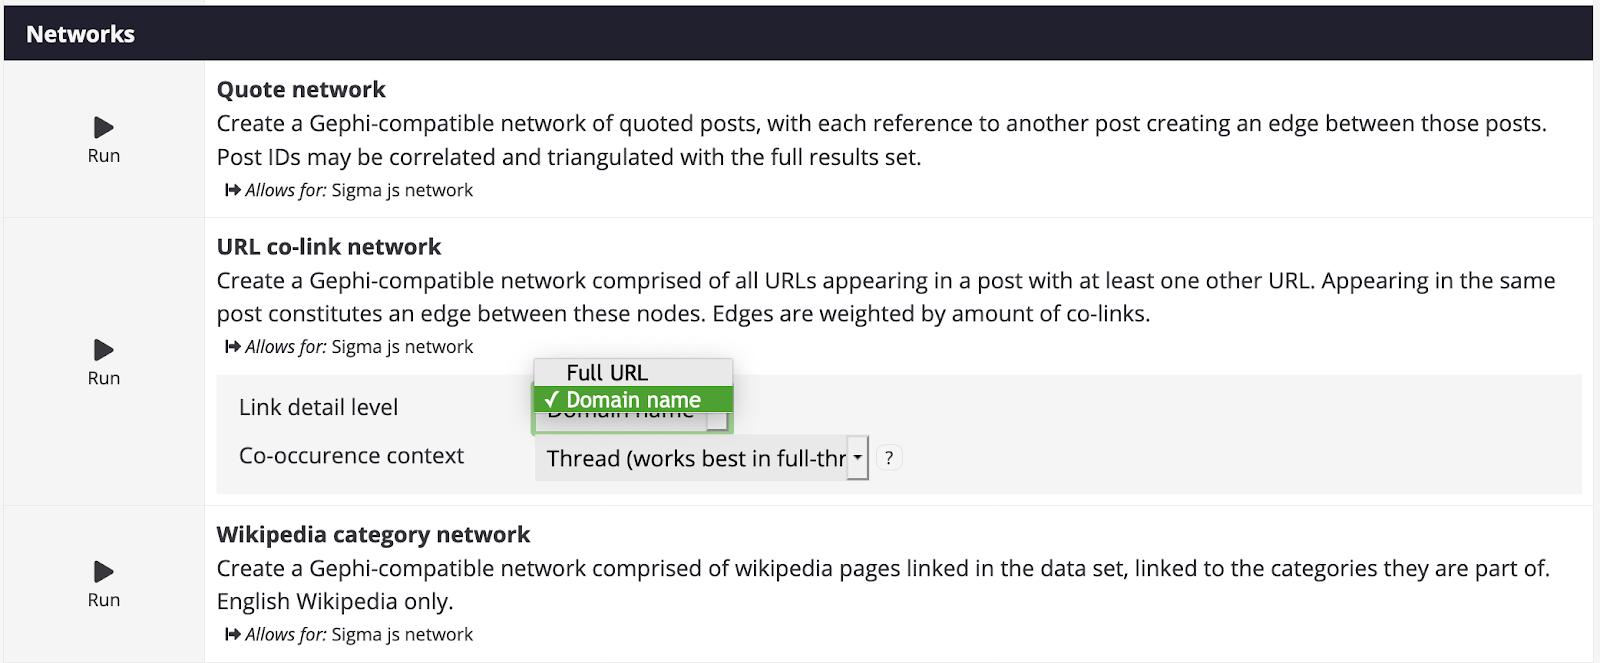
? The difference between posts and threads is a little bit like the difference between a conversation and statements made in that conversation. Posts constitute the statements by single users in that conversation or thread, while a thread is the subject of the conversation.
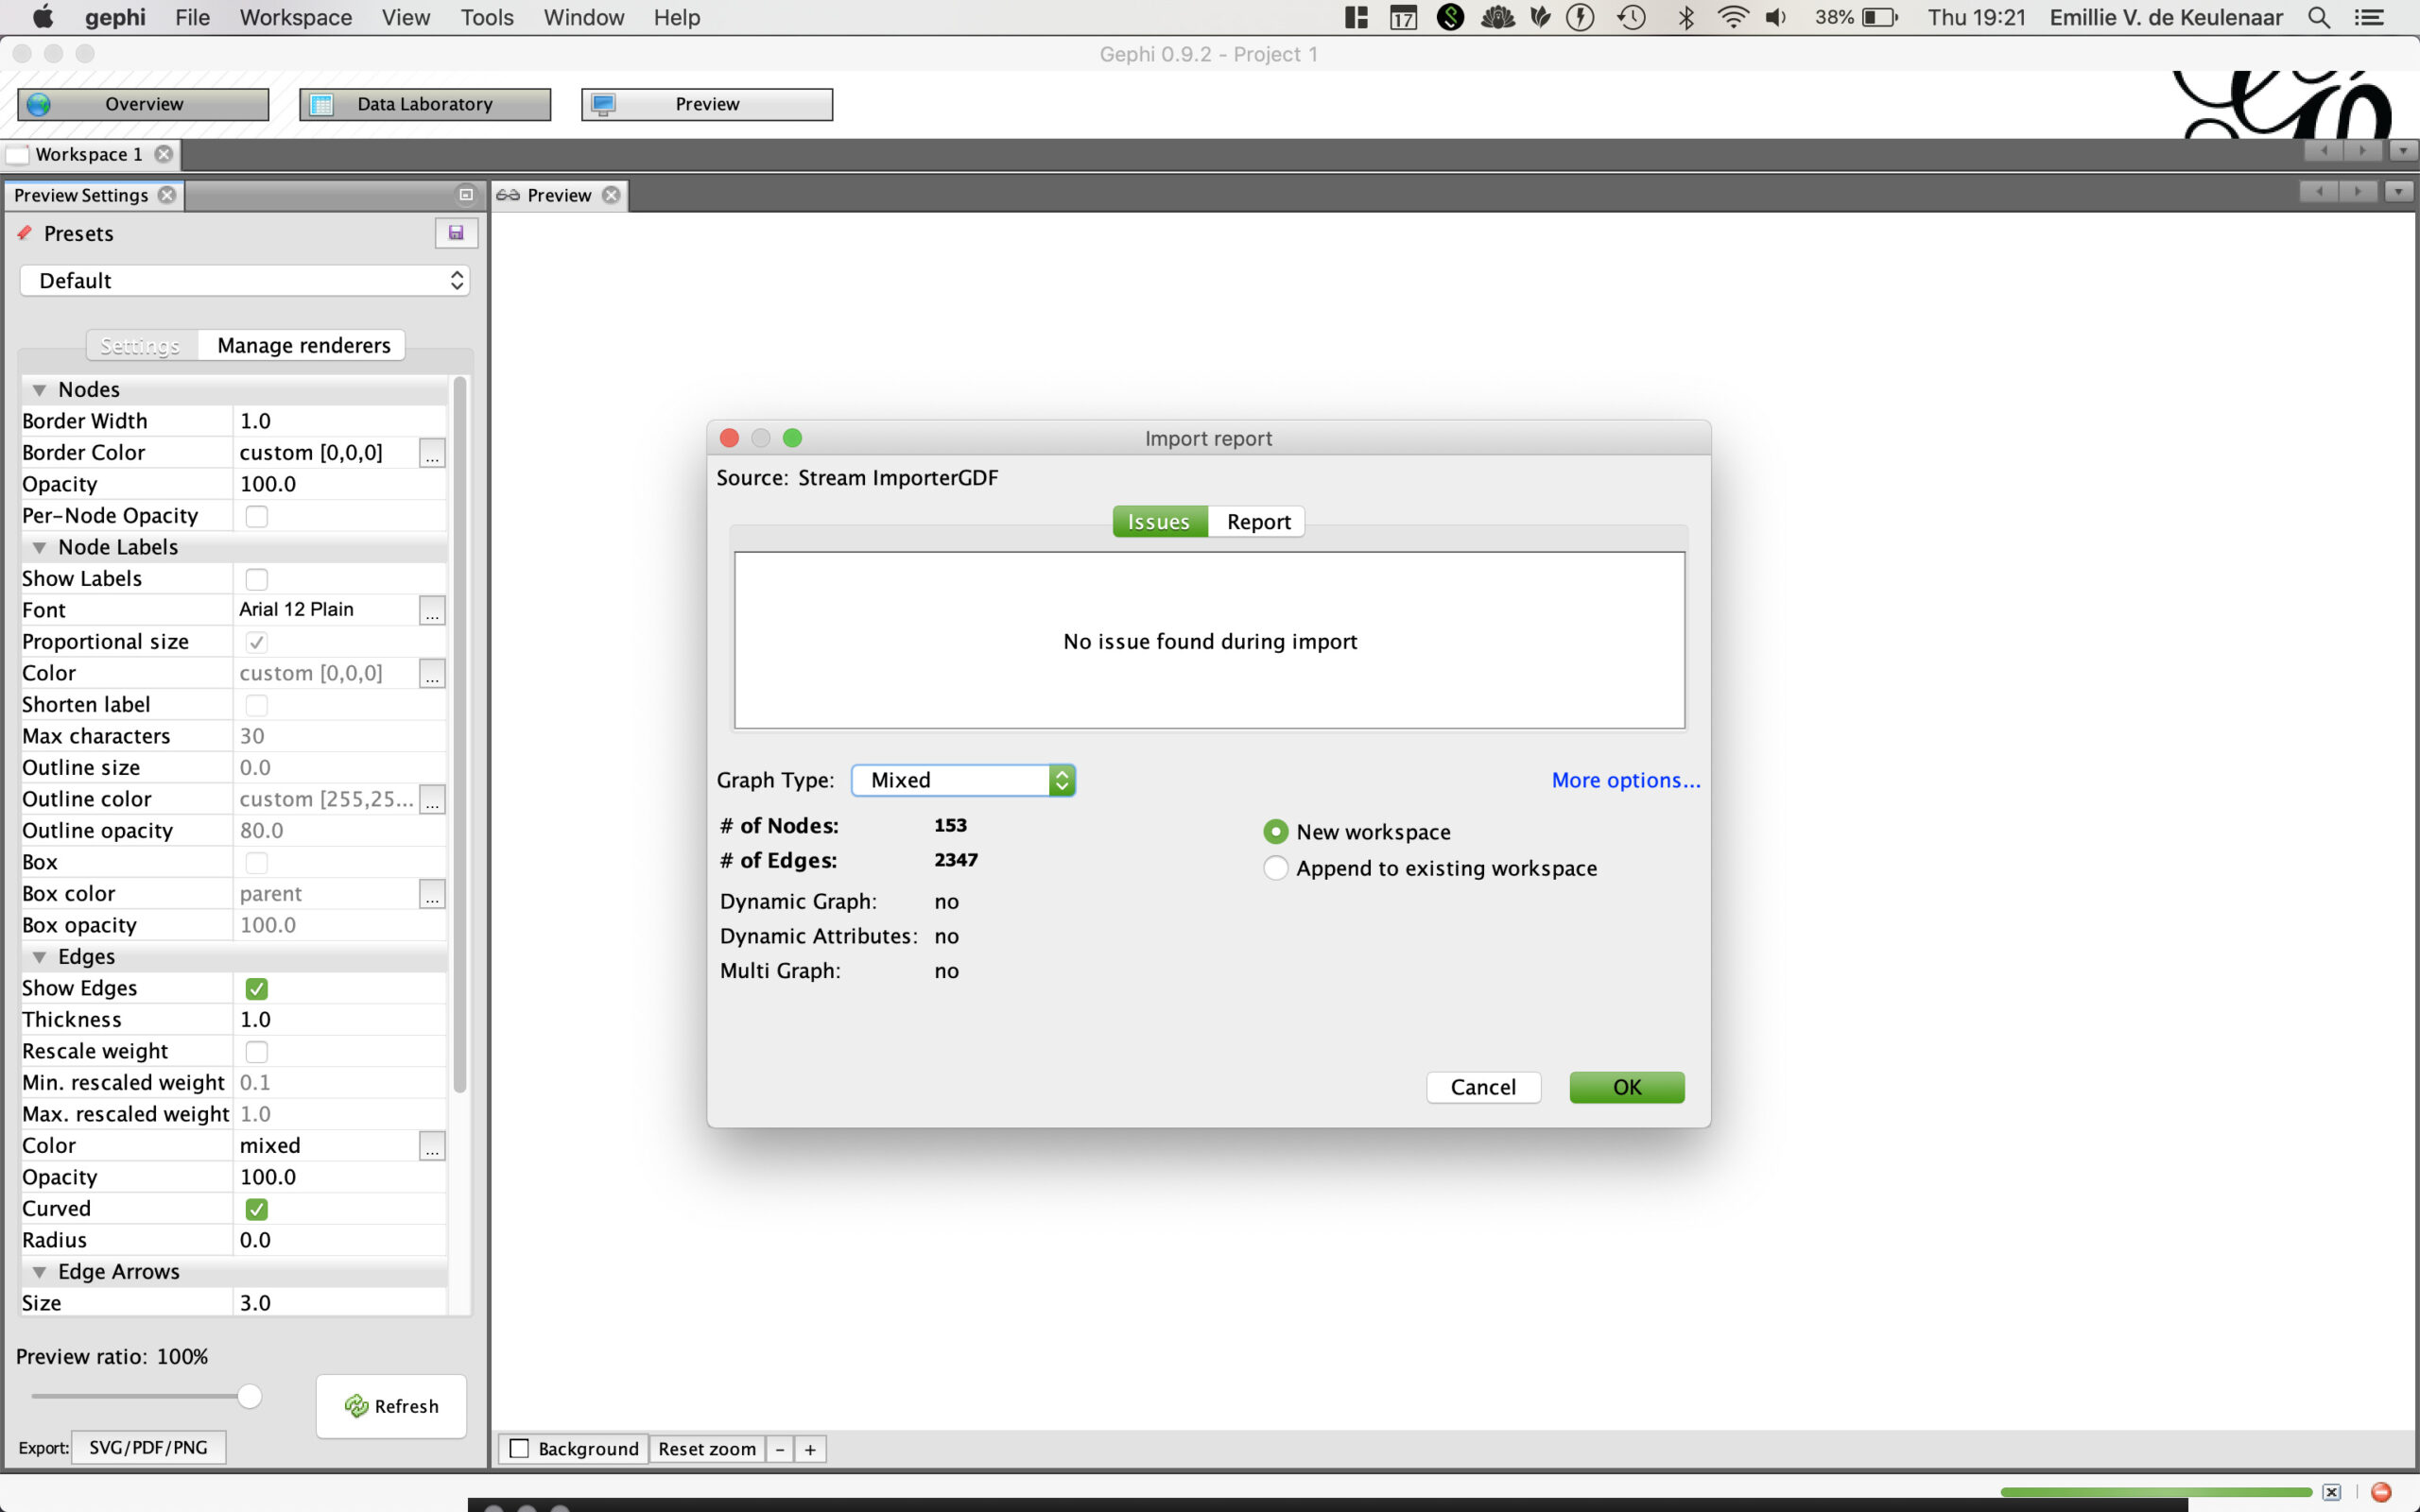
15. After running the co-link network, open and save the resulting file as a gdf.
16. Open your gdf on Gephi and choose a mixed graph type. If you are completely unfamiliar with Gephi, we recommend you visit the recipe How are they funded? Investigating ad architectures with Gephi and the DMI Tracker Tracker tool, which provides an overview on how to use the software.
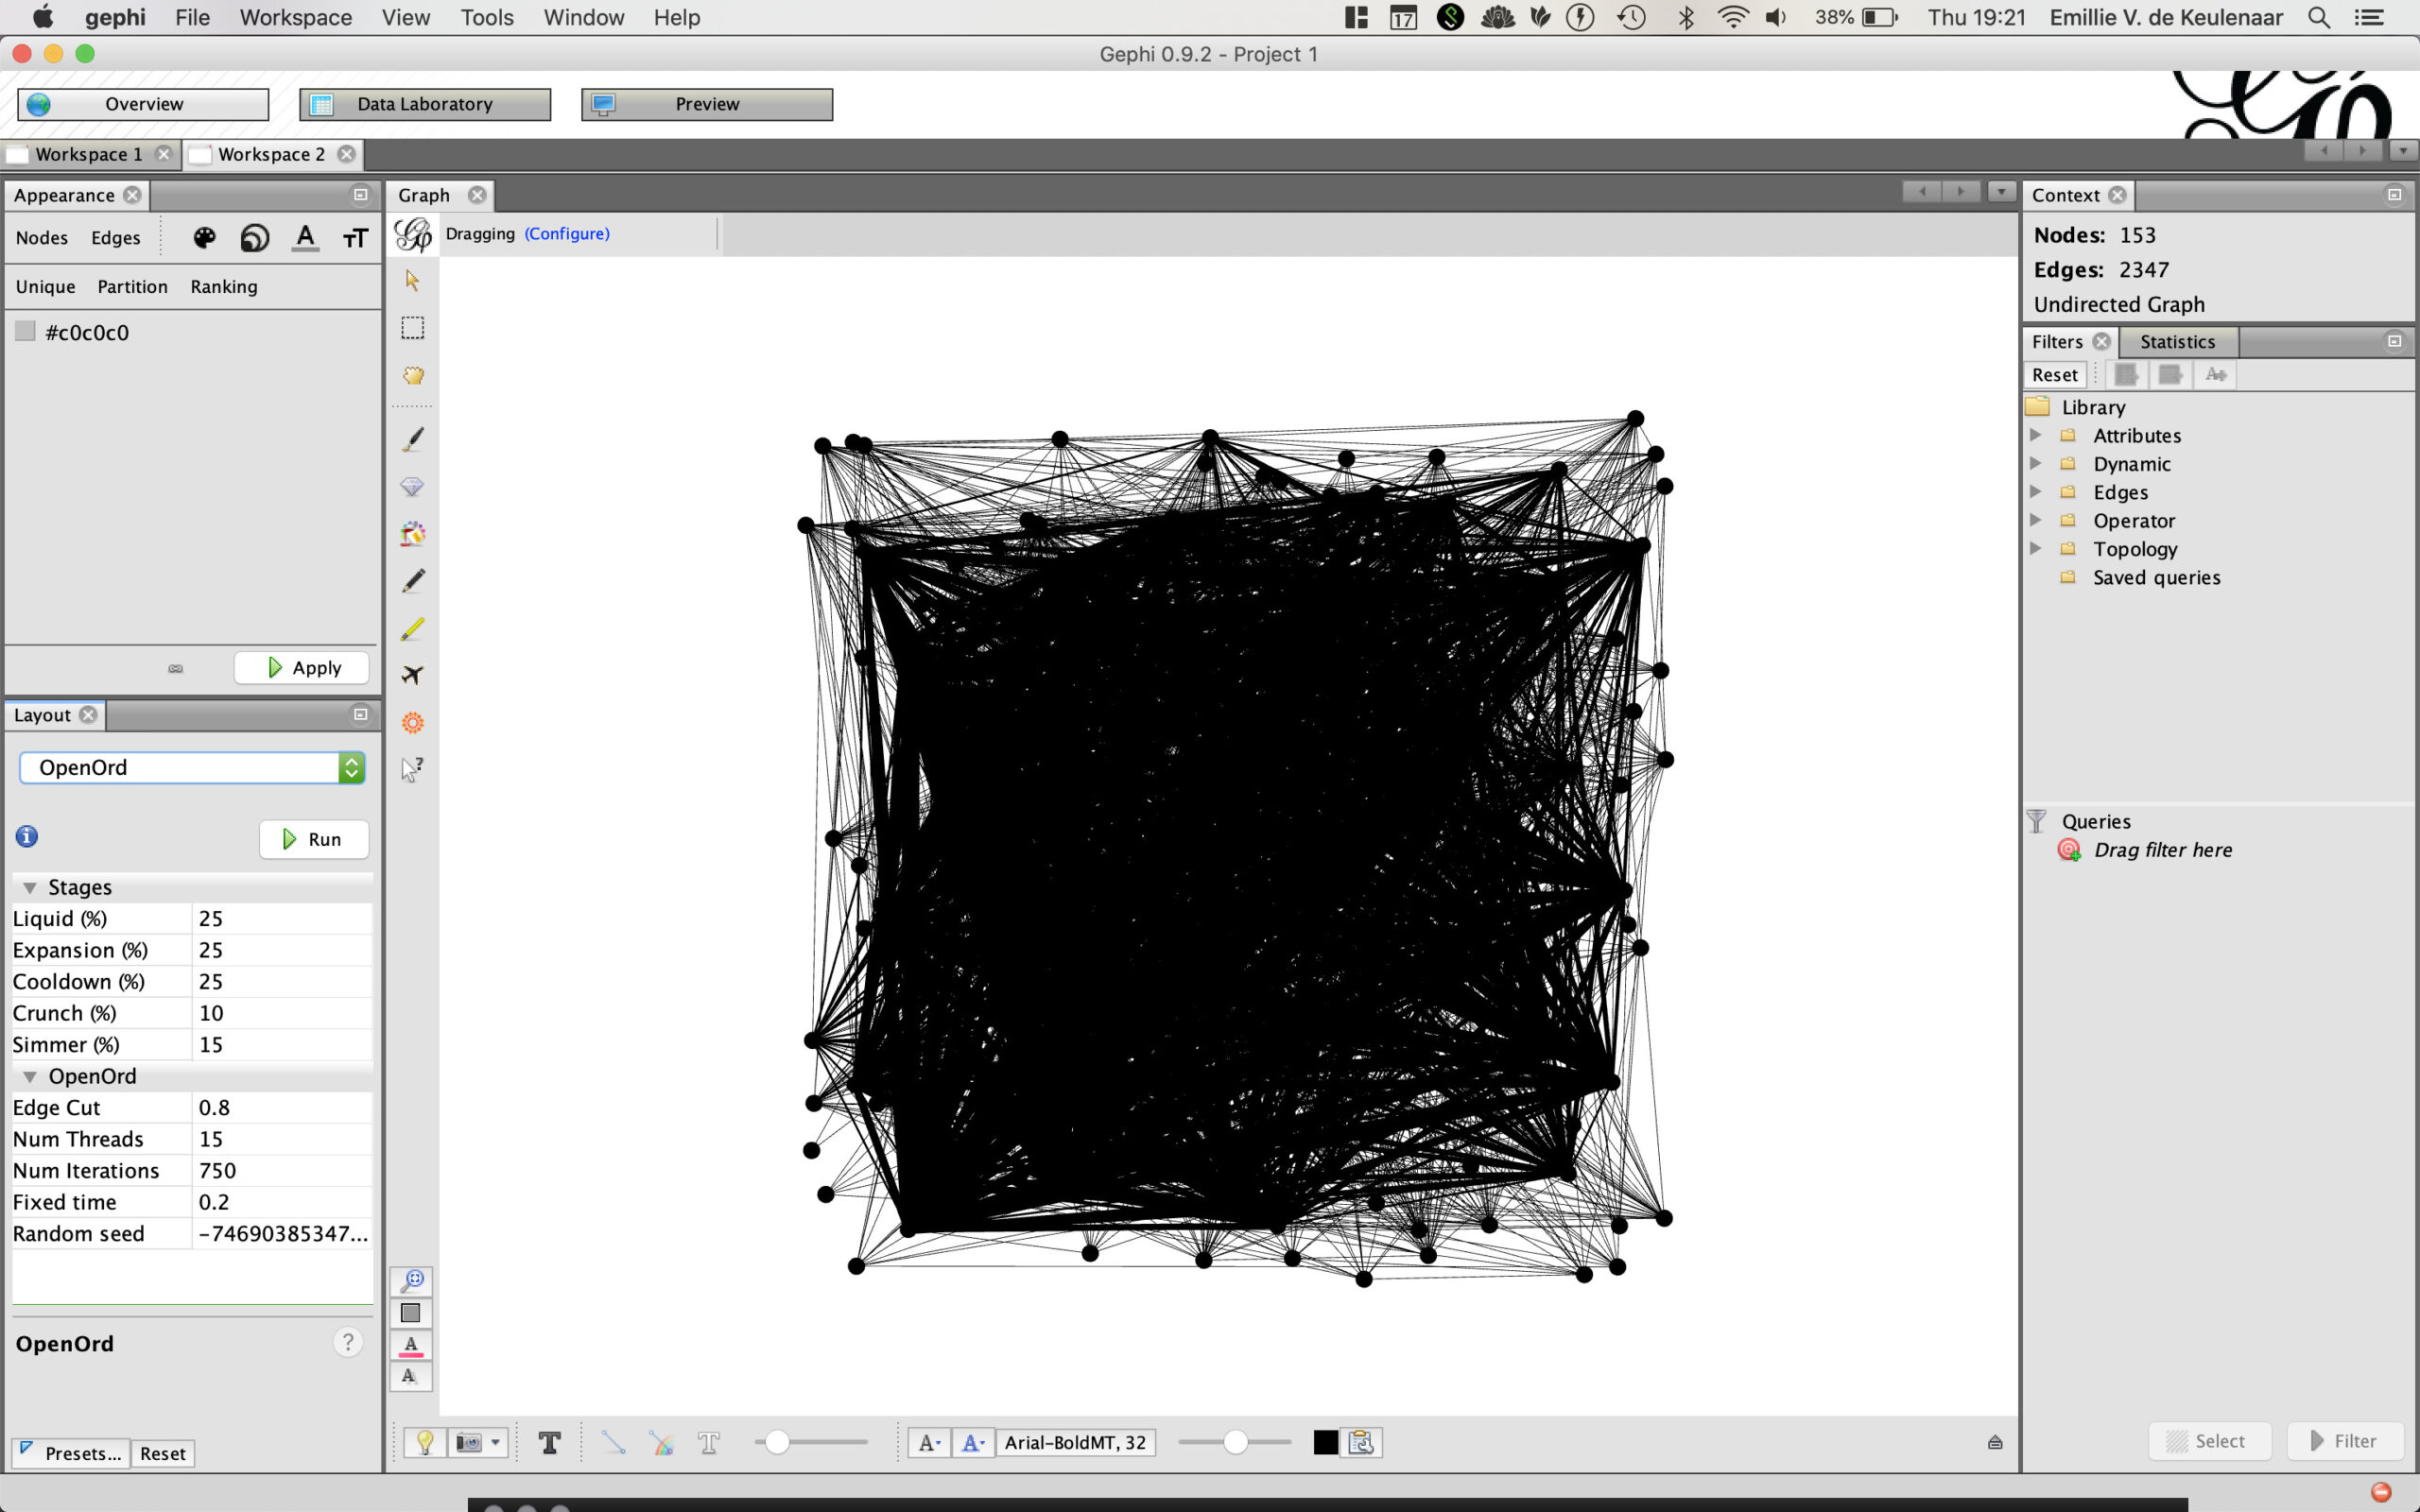
17. On Overview (top right), then under Layout, choose OpenOrd.
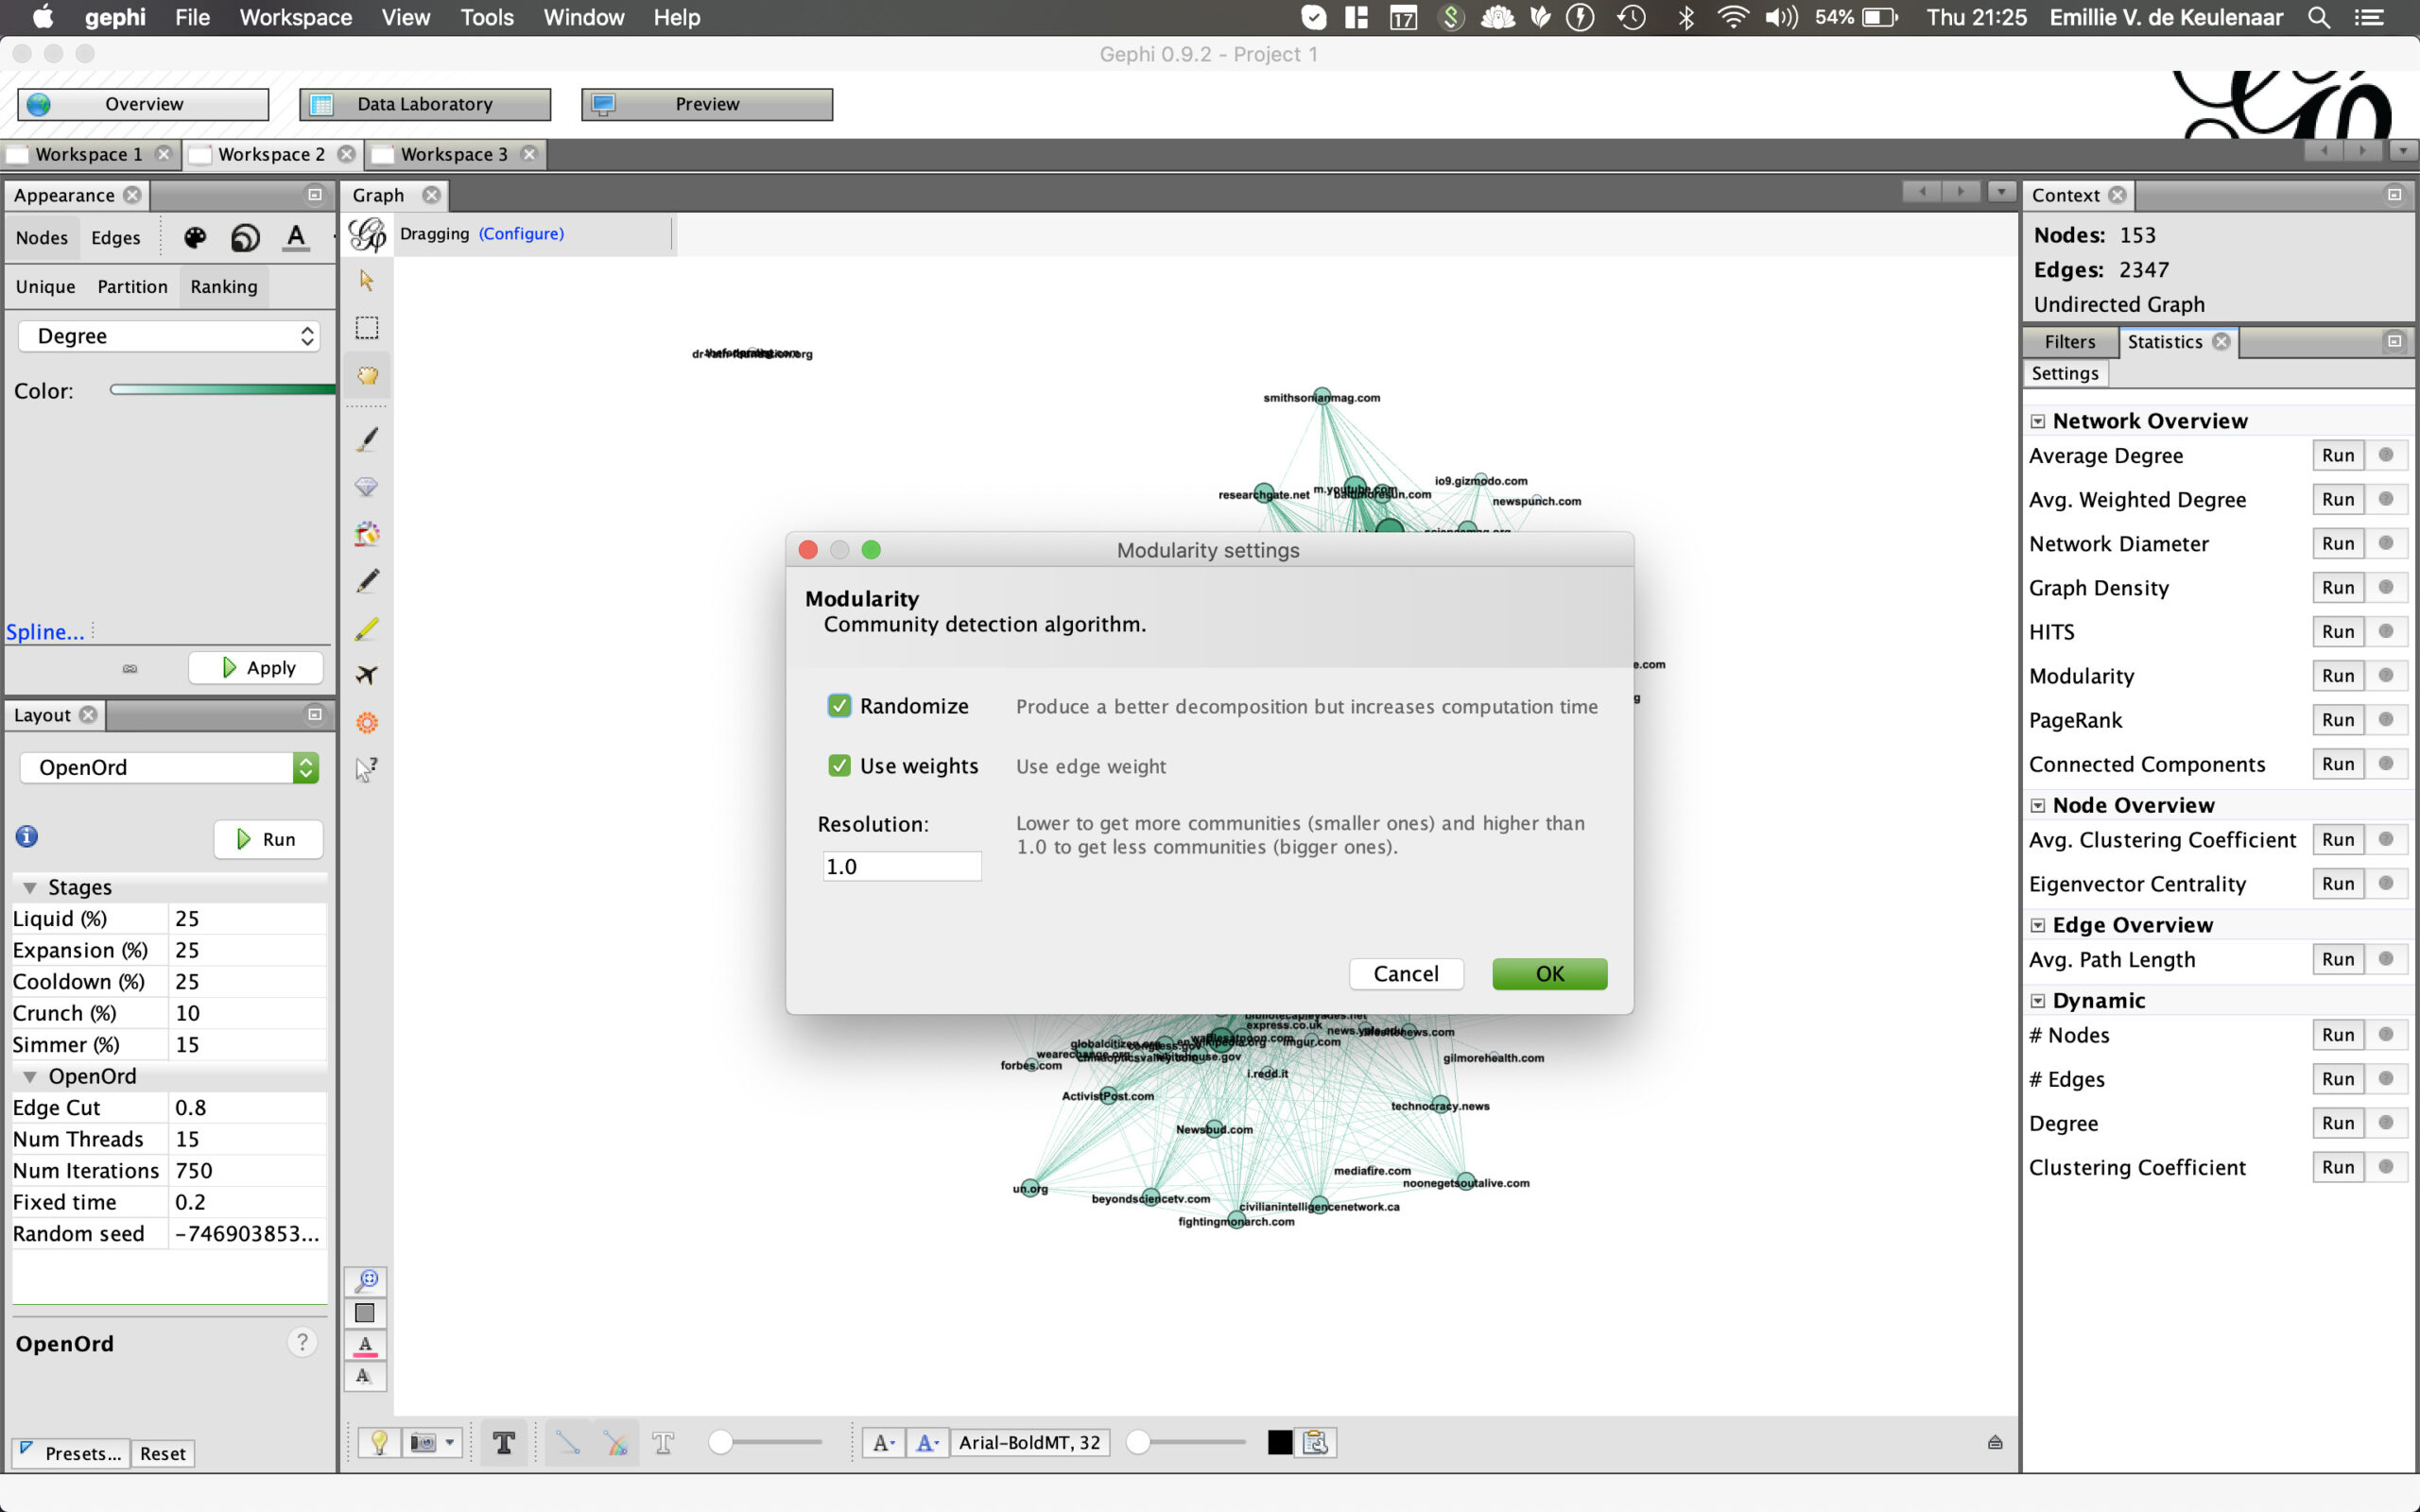
18. To highlight different communities or URLs — those clusters of nodes that have more connections to each other than other nodes in the network — select run the Modularity module under Statistics. Then press OK.
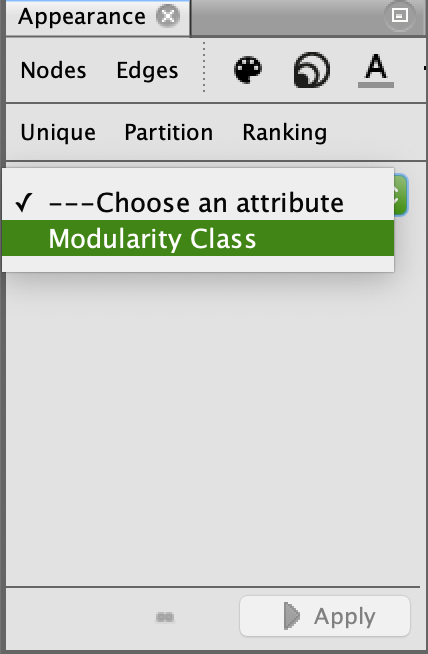
19. Now choose Modularity class as a partition, under appearance. Apply the color palette that Gephi generates.
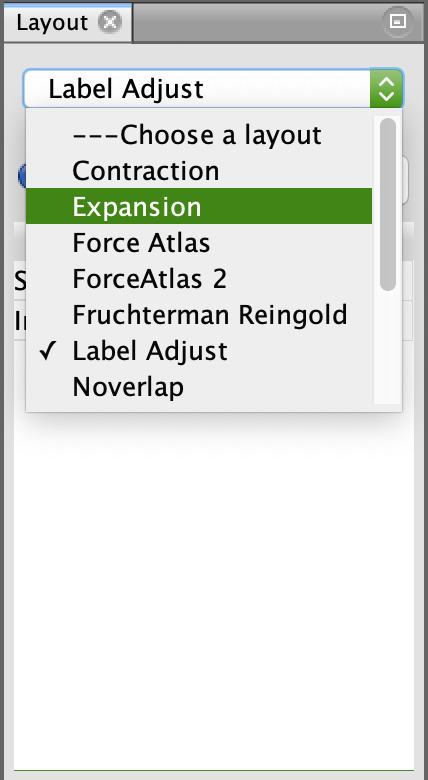
20. If you don’t find the network legible enough, you can also adjust your node labels or expand and contract your graph to your liking under Layout features.
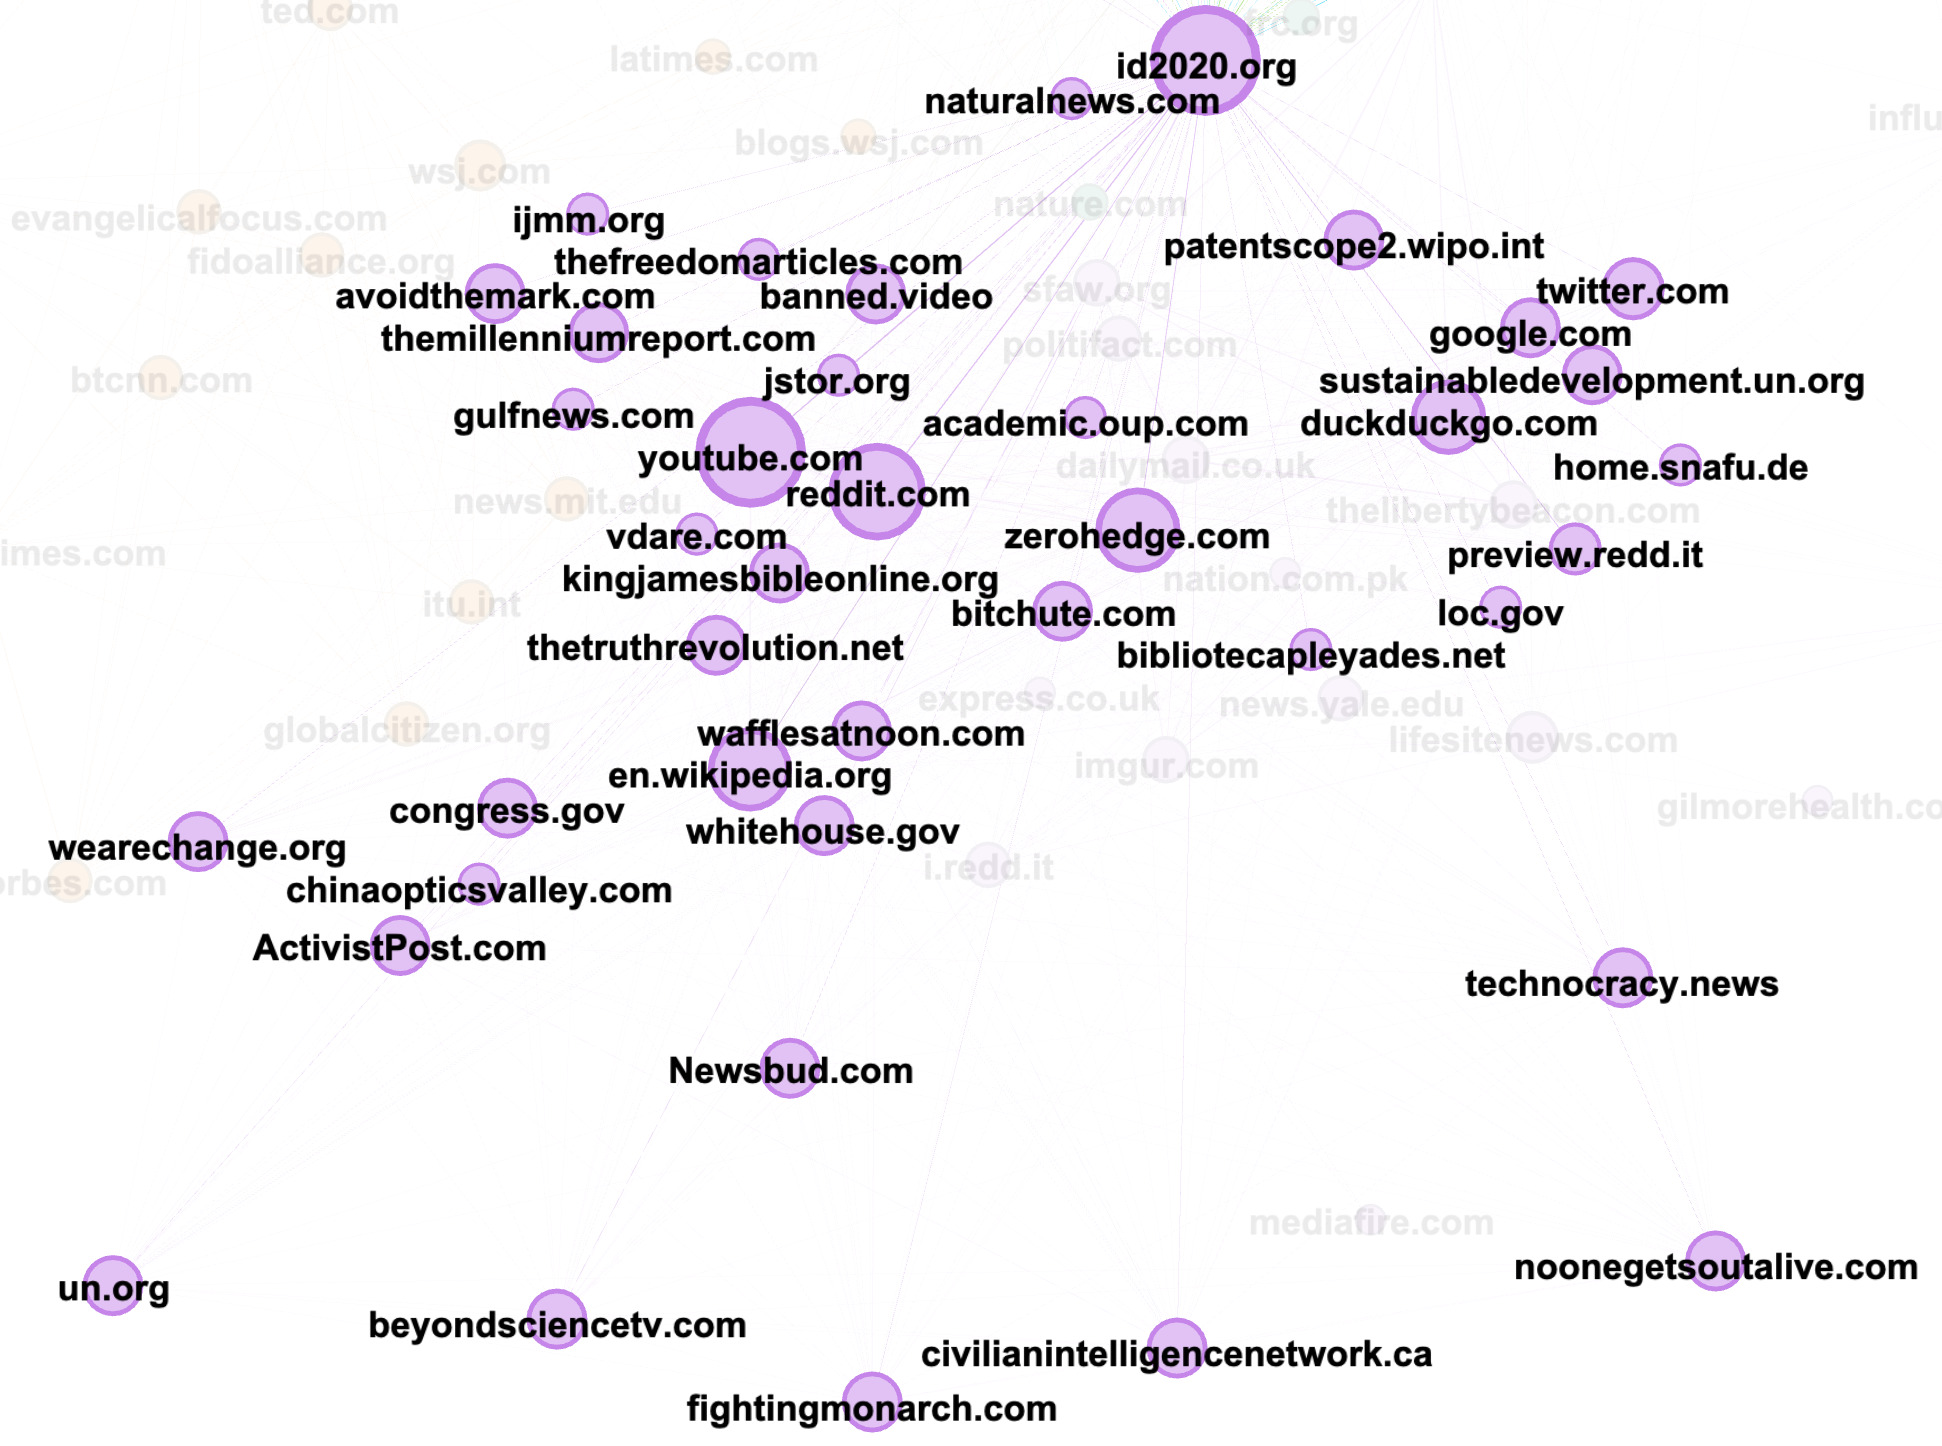
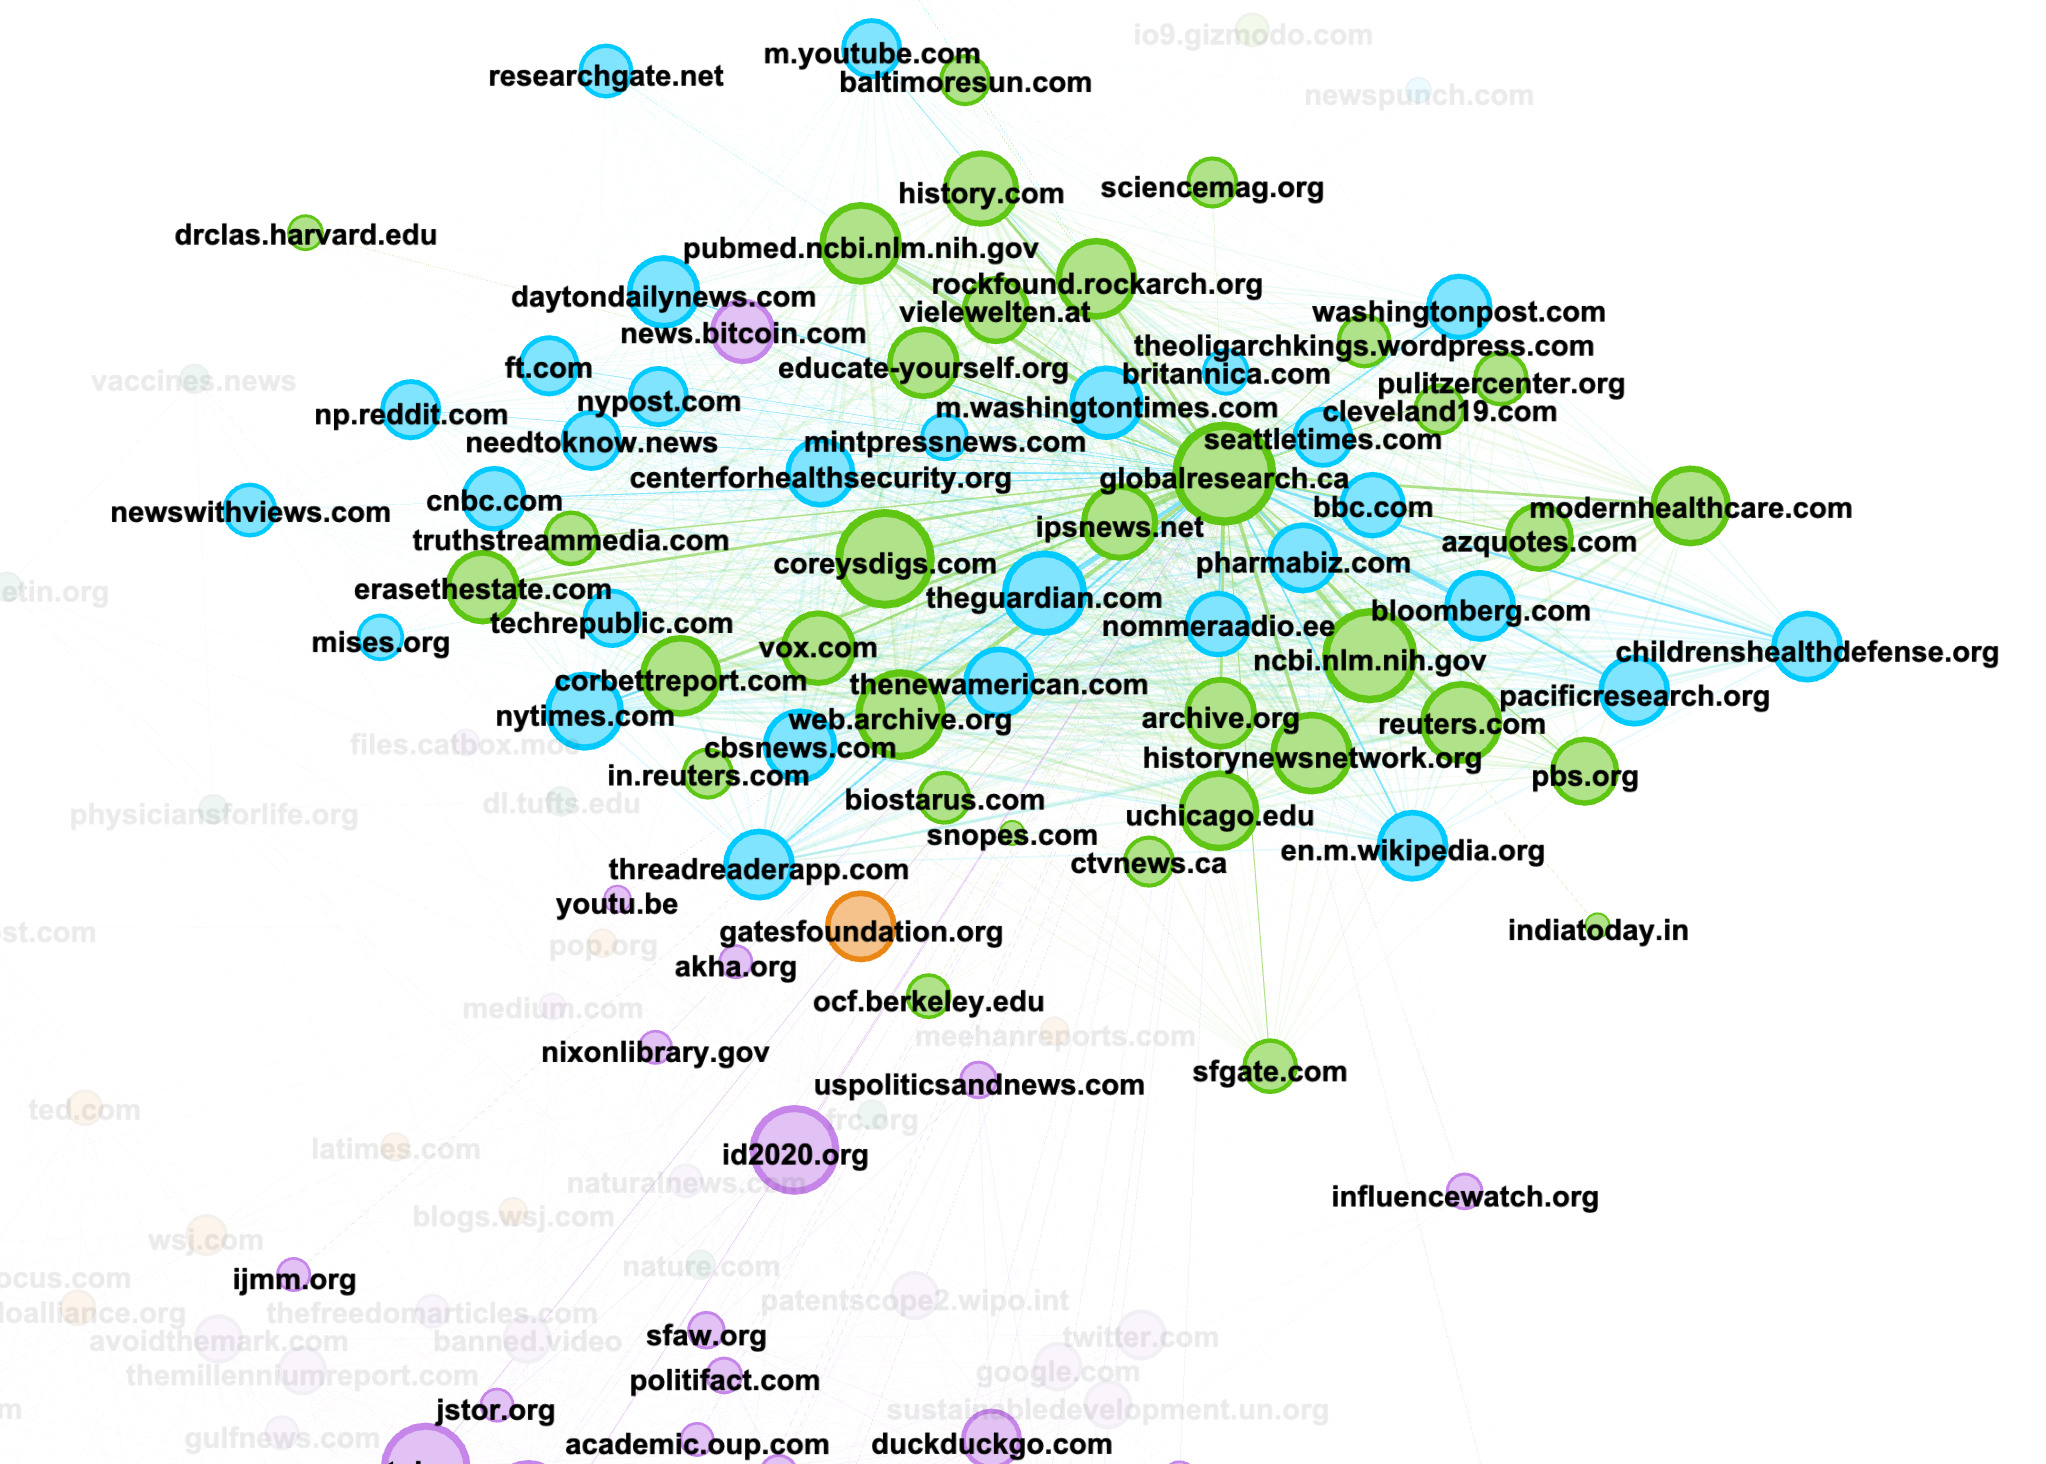
21. Your graph is composed of a number of clusters, as shown below.
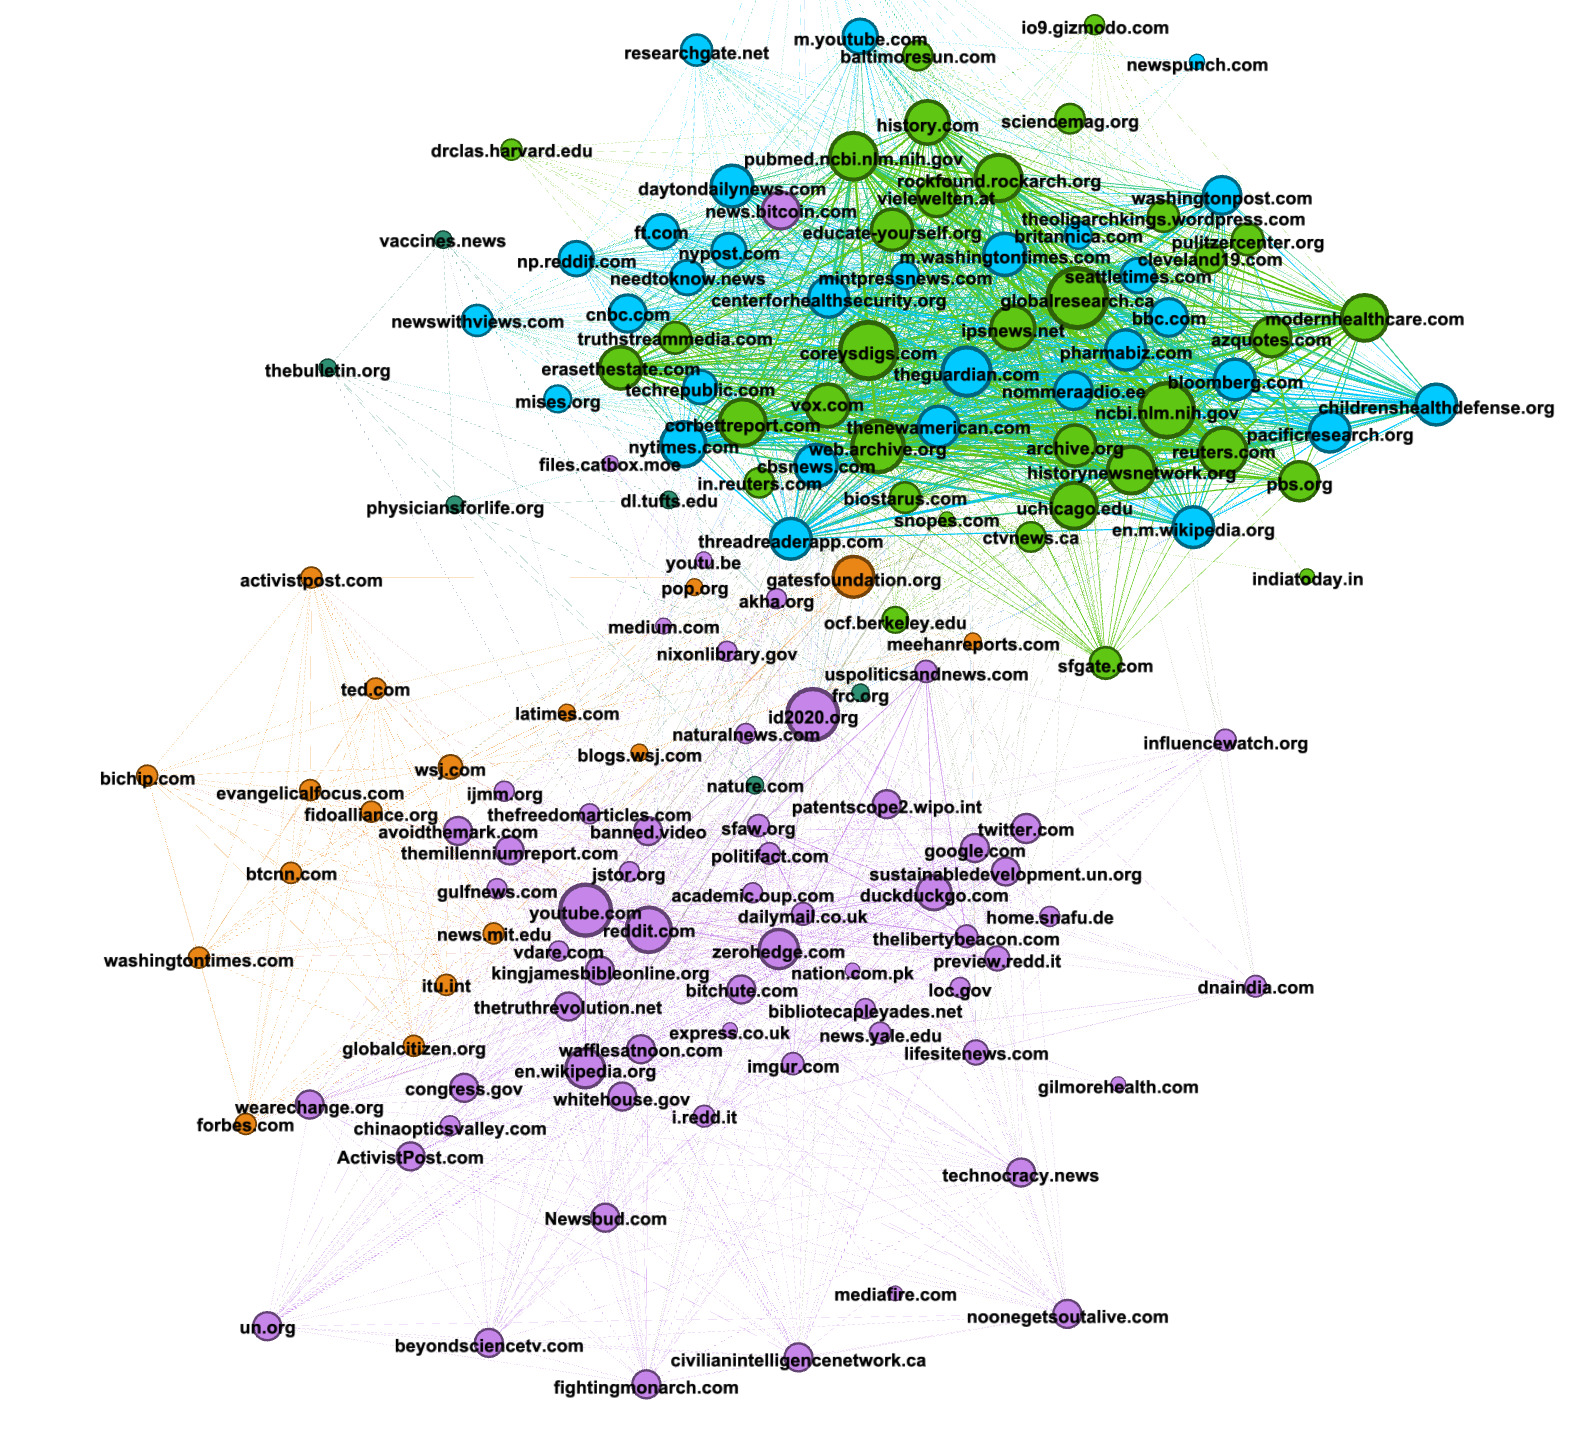
Looking at the purple community, you can see the importance of the website id2020.org, which is surrounded by a series of other urls composed of both alternative and deplatformed media (banned.video) as well as authoritative sources, such as whitehouse.gov, un.org and sustainabledevelopment.un.org. While these are authoritative sources, they are not being used as traditional sources of information (news, research). Manually inspecting the posts containing these URLs reveals instead that they are being used by the purple community to support their claims that id2020 is a project co-sponsored by Bill Gates and the UN.
22. In an upper cluster, we see a constellation of reliable sources such as nytimes.com, researchgate.net, theguardian.com, ncbi.nlm.nih.gov, ofc.berkeley.edu, underlining how reliable sources of information are weaponized by online communities and used as evidence to support what are often outlandish or nonsensical claims.
23. Remember that this is only the network of URLs on Reddit. If you want to see how these networks of “evidence” look on 4chan or 8kun, repeat steps 12-21 for each of those platforms.
This recipe details how you can unearth URLs that are being shared on 4chan, 8kun and Reddit to substantiate narratives, conspiracy theories or pieces of misinformation. It also gives you the tools to visualize the relationships between these URLs to understand how these alternative networks of knowledge are created and identify which particular nodes (or URLs) are being used as key pieces of evidence. While this recipe uses 4chan, 8kun and Reddit, you can also extend parts of this recipe to other platforms. You could, for example, use the URLs you identified in step 5 and see how they traveled across Facebook and Instagram, using CrowdTangle’s Link Checker plugin. You could also search for these URLs on Twitter using Twitter’s Search API or by manually searching them.
Emillie de Keulenaar is a PhD researcher at University of Amsterdam’s Open Intelligence Lab and Simon Fraser University’s Digital Democracies group. She has previously researched with the UN’s Innovation Cell, the Dutch digital humanities cluster CLARIAH, the European Time Machine consortium and the Clingendael Institute. Her interests lie in the role of deep disagreements in producing misinformation, as well as in the history of moderating online hate speech and other problematic information.
Stay up to date with First Draft’s work by becoming a subscriber and following us on Facebook and Twitter.