This article is available also in Deutsch, Español, Français and العربية
By Ryan Watts, Alexandra Ma and Nic Dias
While journalists are now focused on how to debunk disinformation, much less is written about how to monitor what people are discussing on social media, and where and how quickly inaccurate information is spreading. Yet there are a variety of tools available that can (1) help journalists track online conversations in real time and (2) be incorporated into workflows for fact-checking and verifying stories.
As part of the Full Fact/First Draft UK Election Project, we monitored a large number of online conversations for 33 days. Here we offer a short description of our day-to-day operations to serve as a blueprint for journalists looking to respond swiftly to newsworthy conversations and to stem the flow of misinformation.
The products
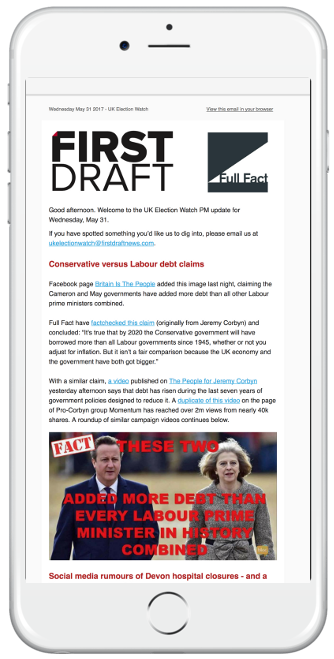
The project sent emails twice a day to subscribers.
We produced two newsletters daily that we sent to our newsroom partners every morning and afternoon.
The morning newsletter was intended to provide our partners with insights into the newsworthy conversations and social content that we were seeing gain traction.
The afternoon email focused mostly on fact-checking or clarifying misleading social media posts, profiling ongoing trends with potential political implications, and highlighting differences between what mainstream newsrooms were covering and what online communities were discussing.
The setups
Before sending out our first newsletter, we devoted a week to compiling a list of UK-focused fabricated news and satirical websites, hyperpartisan blogs, politically charged Facebook pages and groups, subreddits and Twitter hashtags we thought were worth tracking with the help of social trending services like Trendolizer, CrowdTangle and NewsWhip’s Spike. These lists were expanded regularly throughout the election. By June 8, we were tracking 402 sources and topics, and had collected more than 34 million tweets and 220,000 Facebook posts with our servers.
Trendolizer helped us to discover viral content across all social platforms in real time. The tool allowed us to set up searches using a variety of parameters in order to find relevant posts that were performing well. We added a list of election-related search terms and produced multiple Tweetdeck-esque “columns” that judged how well posts performed according to different standards, like shares over a 24-hour period. As we delved into new issues, we added separate columns for those topics.
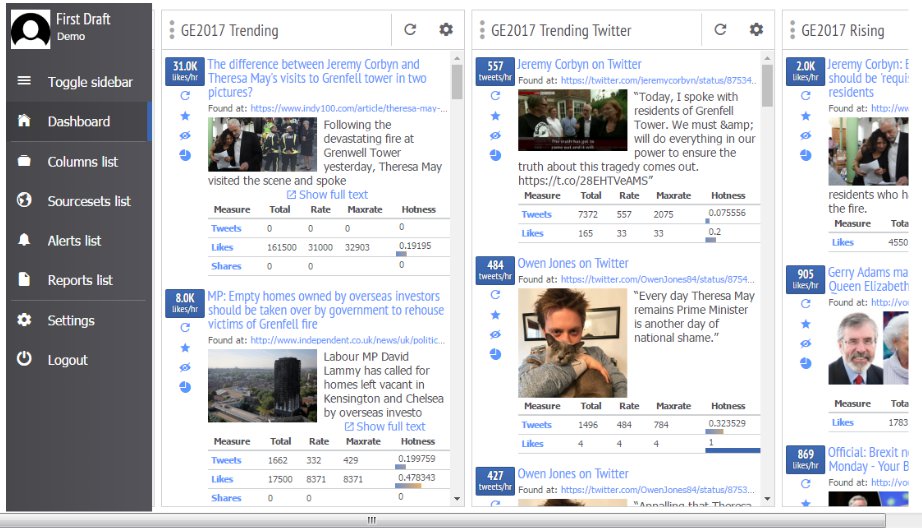
A view of our Trendolizer dashboard.
Facebook’s CrowdTangle helped us to find posts that were over-performing on particular Facebook pages (i.e. attracting more interactions than normal for that page). For more detailed statistics on social media posts or articles, we relied on Newswhip Spike, which spotlights top-performing articles and provides reliable projections of their future share rates.
To observe broader Twitter conversations encompassing many hashtags, we used Trendsmap, which logs the growth and geographic dispersal of the use of hashtags and keywords on Twitter. The tool was also useful for identifying the tweets driving trends, as well as getting rough minimum estimates of how many automated accounts had shared these tweets.
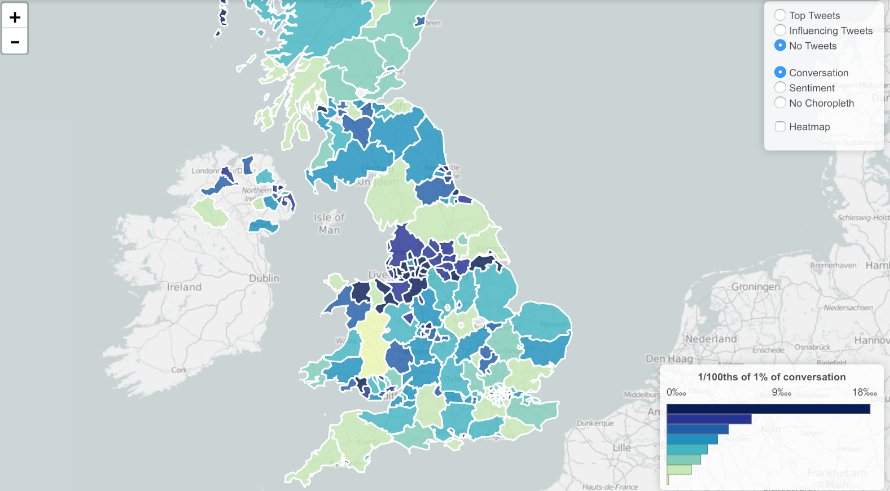
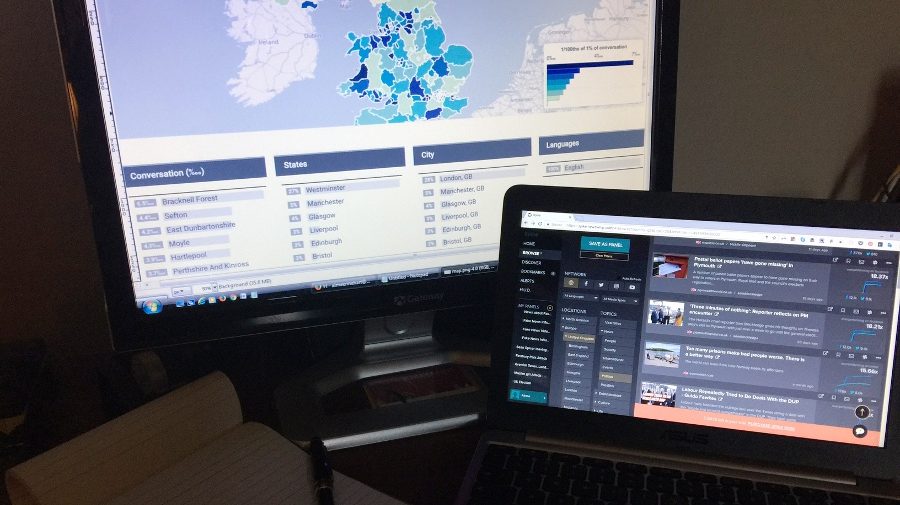
Trendsmap helped us to visualize where specific conversations were happening.
We didn’t neglect traditional news sources, either. Every day, we monitored newspaper front pages and tuned in to key morning radio shows (like the Today programme, Steve Allen on LBC and BBC Radio 5’s Wake Up to Money) to compare mainstream media coverage with social media conversations.
To pull public post data from Facebook and Twitter, we set up one server for each social network and began to collect post data one month before election day.**
Our Facebook server enabled us to identify where and when pages and groups gravitated around particular links and topics. Additionally, the server let us examine topical differences in conversations taking place along different points of the political spectrum. The data more generally provided us versatility in our analyses when it was needed.
Our Twitter server wholistically archived tweets including at least one of the hashtags or domains we had identified. These were handy in watching the relative popularity of different domains and hashtags, as well as assessing what roles content producers played in trends. Our collection net was regularly expanded by checking for new hashtags in our dataset.
Takeaways
1) The performance statistics of a social media post, rather than just its content alone, could be a source of practical information for fact-checkers. Beyond saying whether a statement was false, we were able to provide an assessment of how important a particular post would be in a larger pattern or trend. This became crucial, as there was almost always too much to cover. Approaching the multitude of social media posts from a viewpoint informed by post data allowed us to give value-added analyses to our newsroom partners. For example, when a nationalist Facebook page posted a misleading video of an alleged attack by a refugee, knowing that the post fit a trend of similar posts from that page, with a similar scale of reaction, meant we knew not to give the post too much attention.
2) The fast-paced and inundating work of daily fact-checking and verification meant that, as far as analytics tools went, speed was key. Notably, our collection servers allowed us to analyze data in ways we otherwise couldn’t have, and supported several of our stories. But given the range of features offered by user-friendly tools such as Trendsmap, it was more efficient to use them as a first port-of-call than it was to use our servers.
3) Above all, our project underscored the importance of monitoring overall social media trends and patterns as well as individual stories and posts, where newsrooms tend to fixate. By picking up on larger conversations, we were able to focus on topics that voters online cared about most, such as tactical voting, voter registration and social issues — rather than Brexit negotiations, for example.
Appendix
* We specifically wanted to focus on the following topics: Brexit, climate change, immigration, healthcare, defence, police and law enforcement, pensions, and education. After Theresa May’s fox hunting comment, we decided to add the topic of animal hunting to the mix — it was through doing this that we found that conversations about fox hunting and animal cruelty sustained even after Theresa May stopped mentioning her stance on fox hunting.
** To scrape posts from public Facebook pages and groups, we adapted scripts from Max Woolf. We kept our lists of pages and groups to be picked up by the scripts on Google Sheets, which also served as the task queue for our scripts. The shareable nature of Google Sheets also allowed team members to add pages and groups to our collection cycle whenever available. Recent posts were re-collected on an hourly basis, so that we could track the growth of individual posts. A third script prepared (also on an hourly basis) the data for export as a Zip file, which was downloadable from a simple HTTP server. This let team members download up-to-date Facebook data independently, without having to transfer files via the terminal.
We set up Social Feed Manager (SFM) on a second server to collect tweets. SFM again let non-programmers to start, change and export data collections. Our primary method of collection was the Search API, which was called on an hourly basis. This method was chosen over the Streaming API because it let us avoid losing data during query changes or server problems. API keys were generated by the server administrator on a needs basis, but journalists were also permitted to generate keys themselves.
Server details:
Facebook – 8GB of RAM, 4 CPUs, 60GB SSD Disk
Twitter – 16GB of RAM, 8 CPUs, 160GB SSD Disk
Facebook and Google News Lab supported First Draft and Full Fact to work with major newsrooms to address rumours and misinformation spreading online during the UK general election.
This is the second of a series of blog posts about the Full Fact-First Draft UK Election project. UK election first post: what we learned working with Full Fact